
Study Notes
Overview
Welcome to the cornerstone of practical science: observing, measuring, and recording. This topic (AQA specification reference 4.3) isn't just about writing down numbers; it’s about demonstrating your competence as a scientist. Examiners rigorously assess these skills across all 21 Required Practicals, making them a high-value area for securing marks. A strong grasp of this topic shows you can work systematically, handle data correctly, and understand the limitations of your measurements. In your exam, you'll face questions that ask you to read scales, construct data tables, calculate means, and evaluate the quality of data. This guide will equip you with the techniques to answer these questions with confidence, ensuring you don't lose easy marks on the fundamentals.
Key Concepts
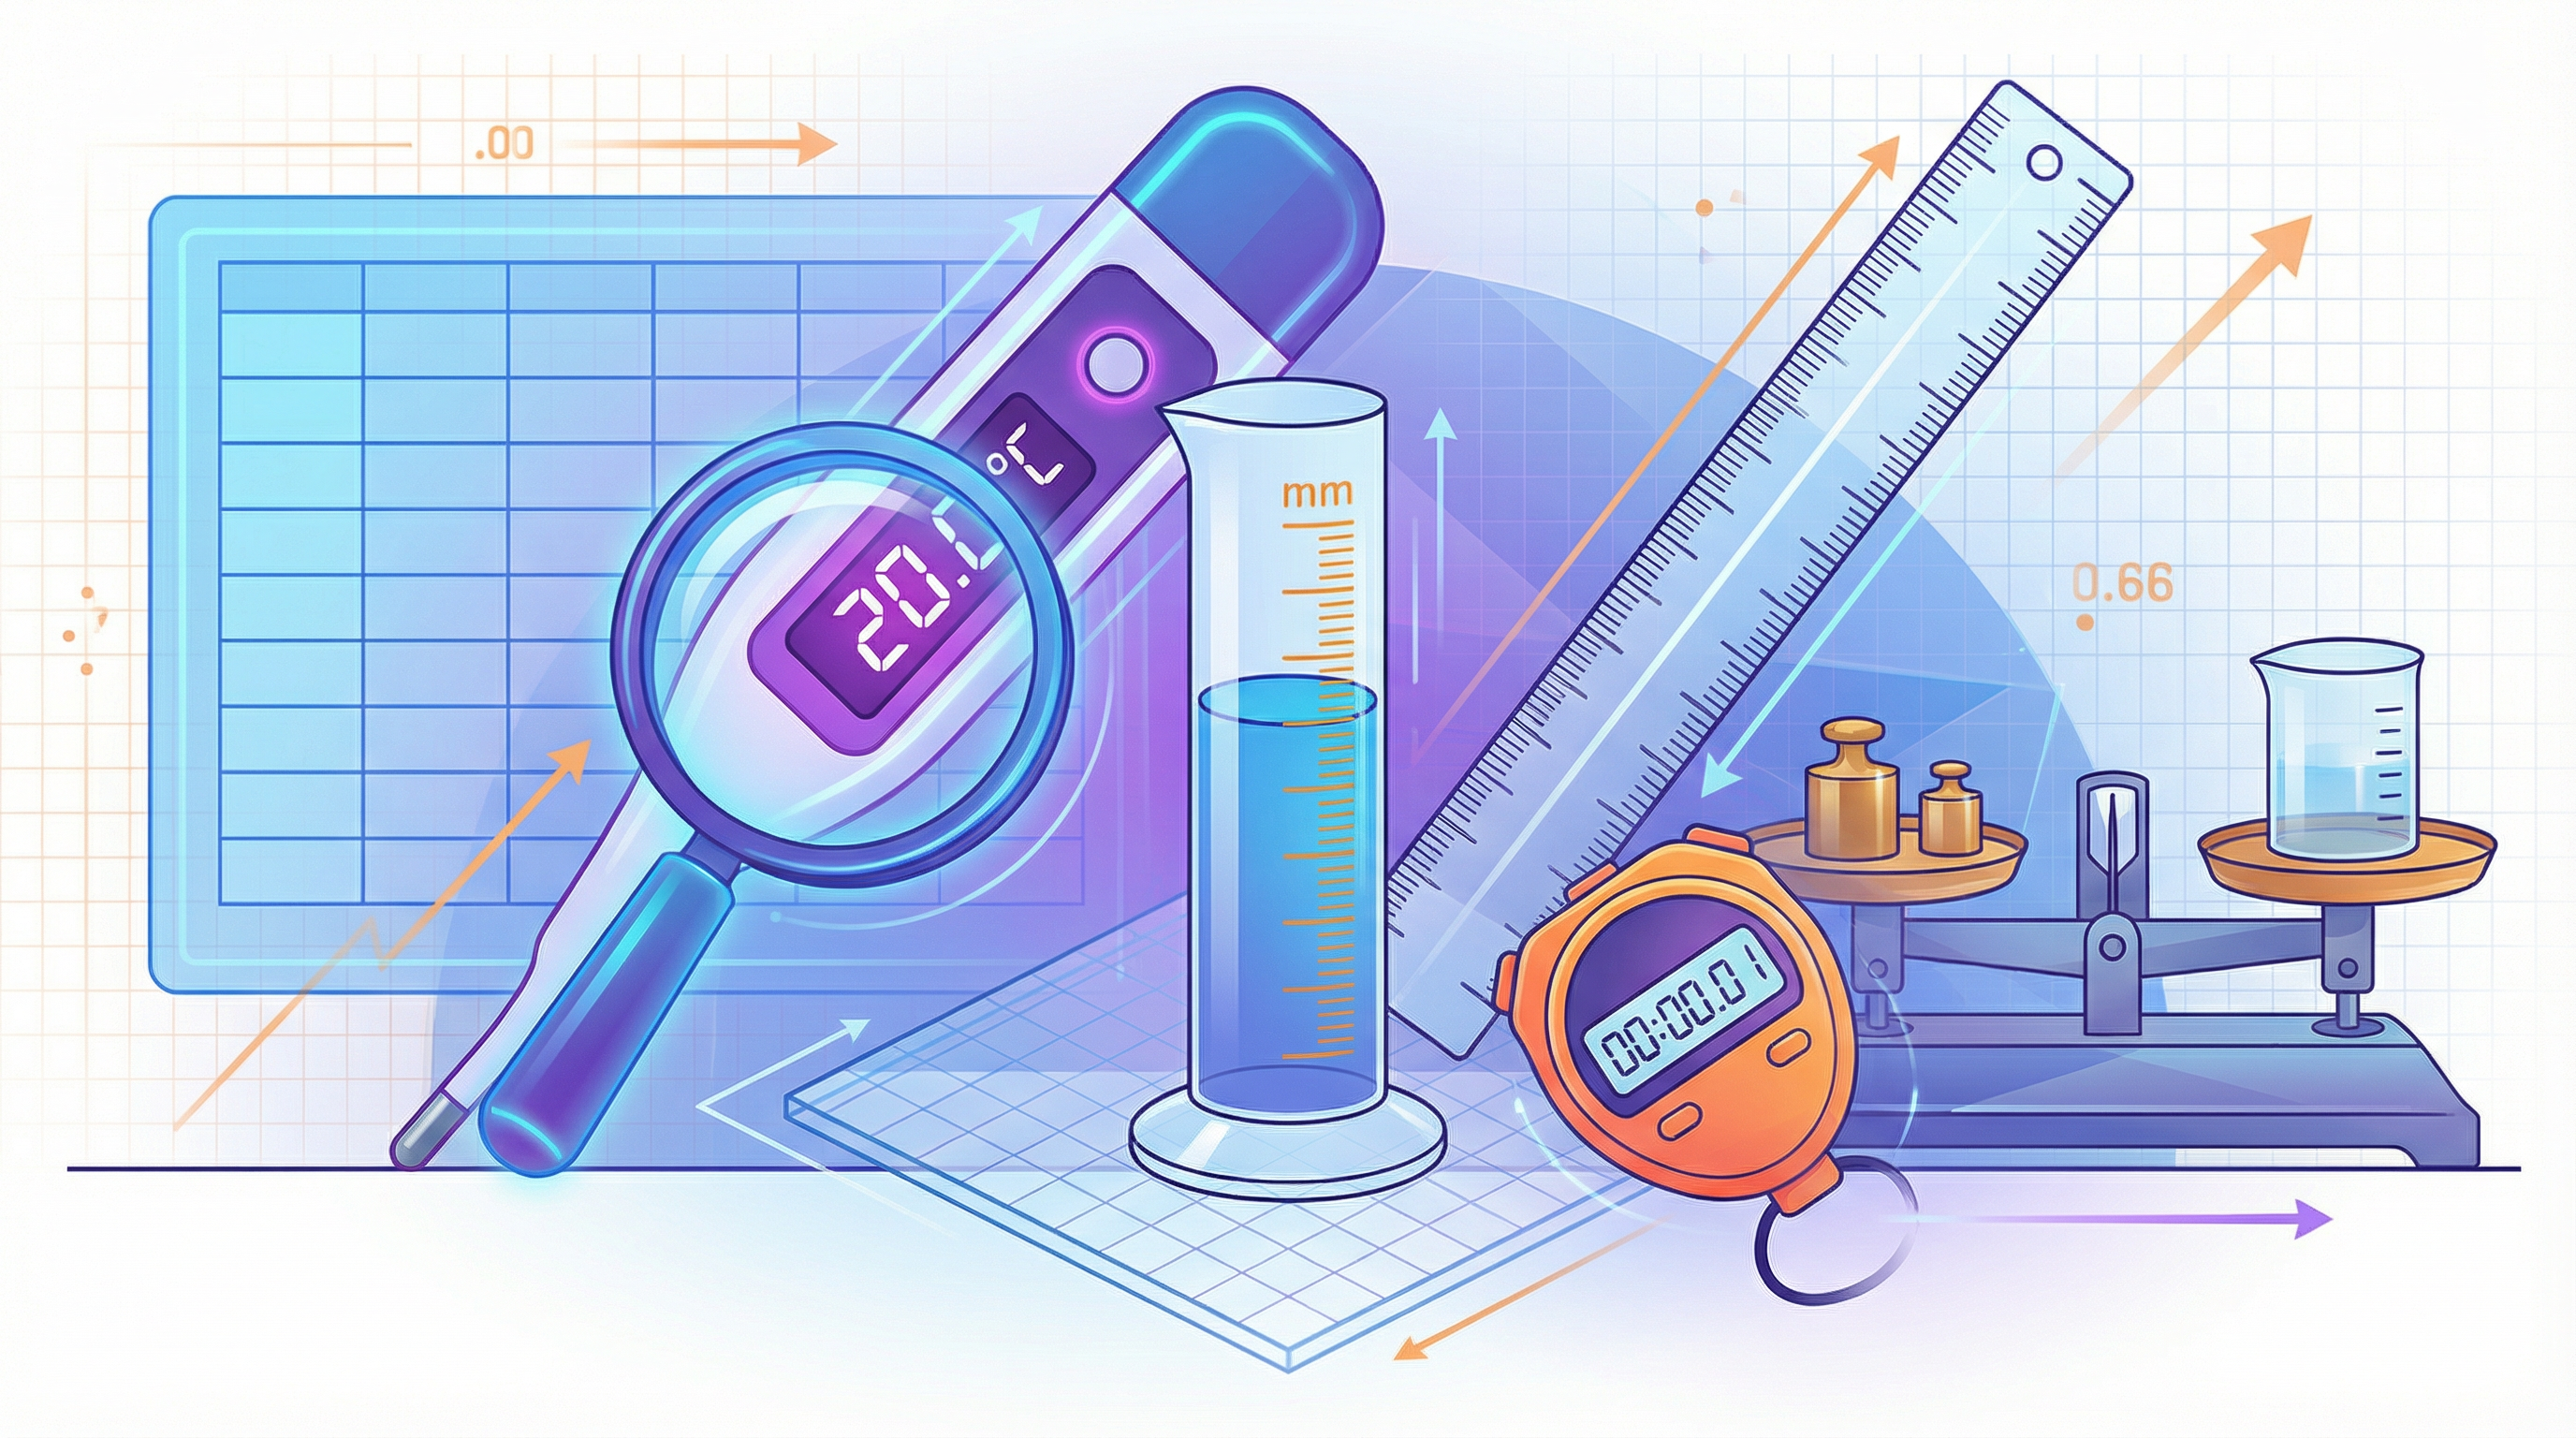
Concept 1: Choosing and Using Apparatus
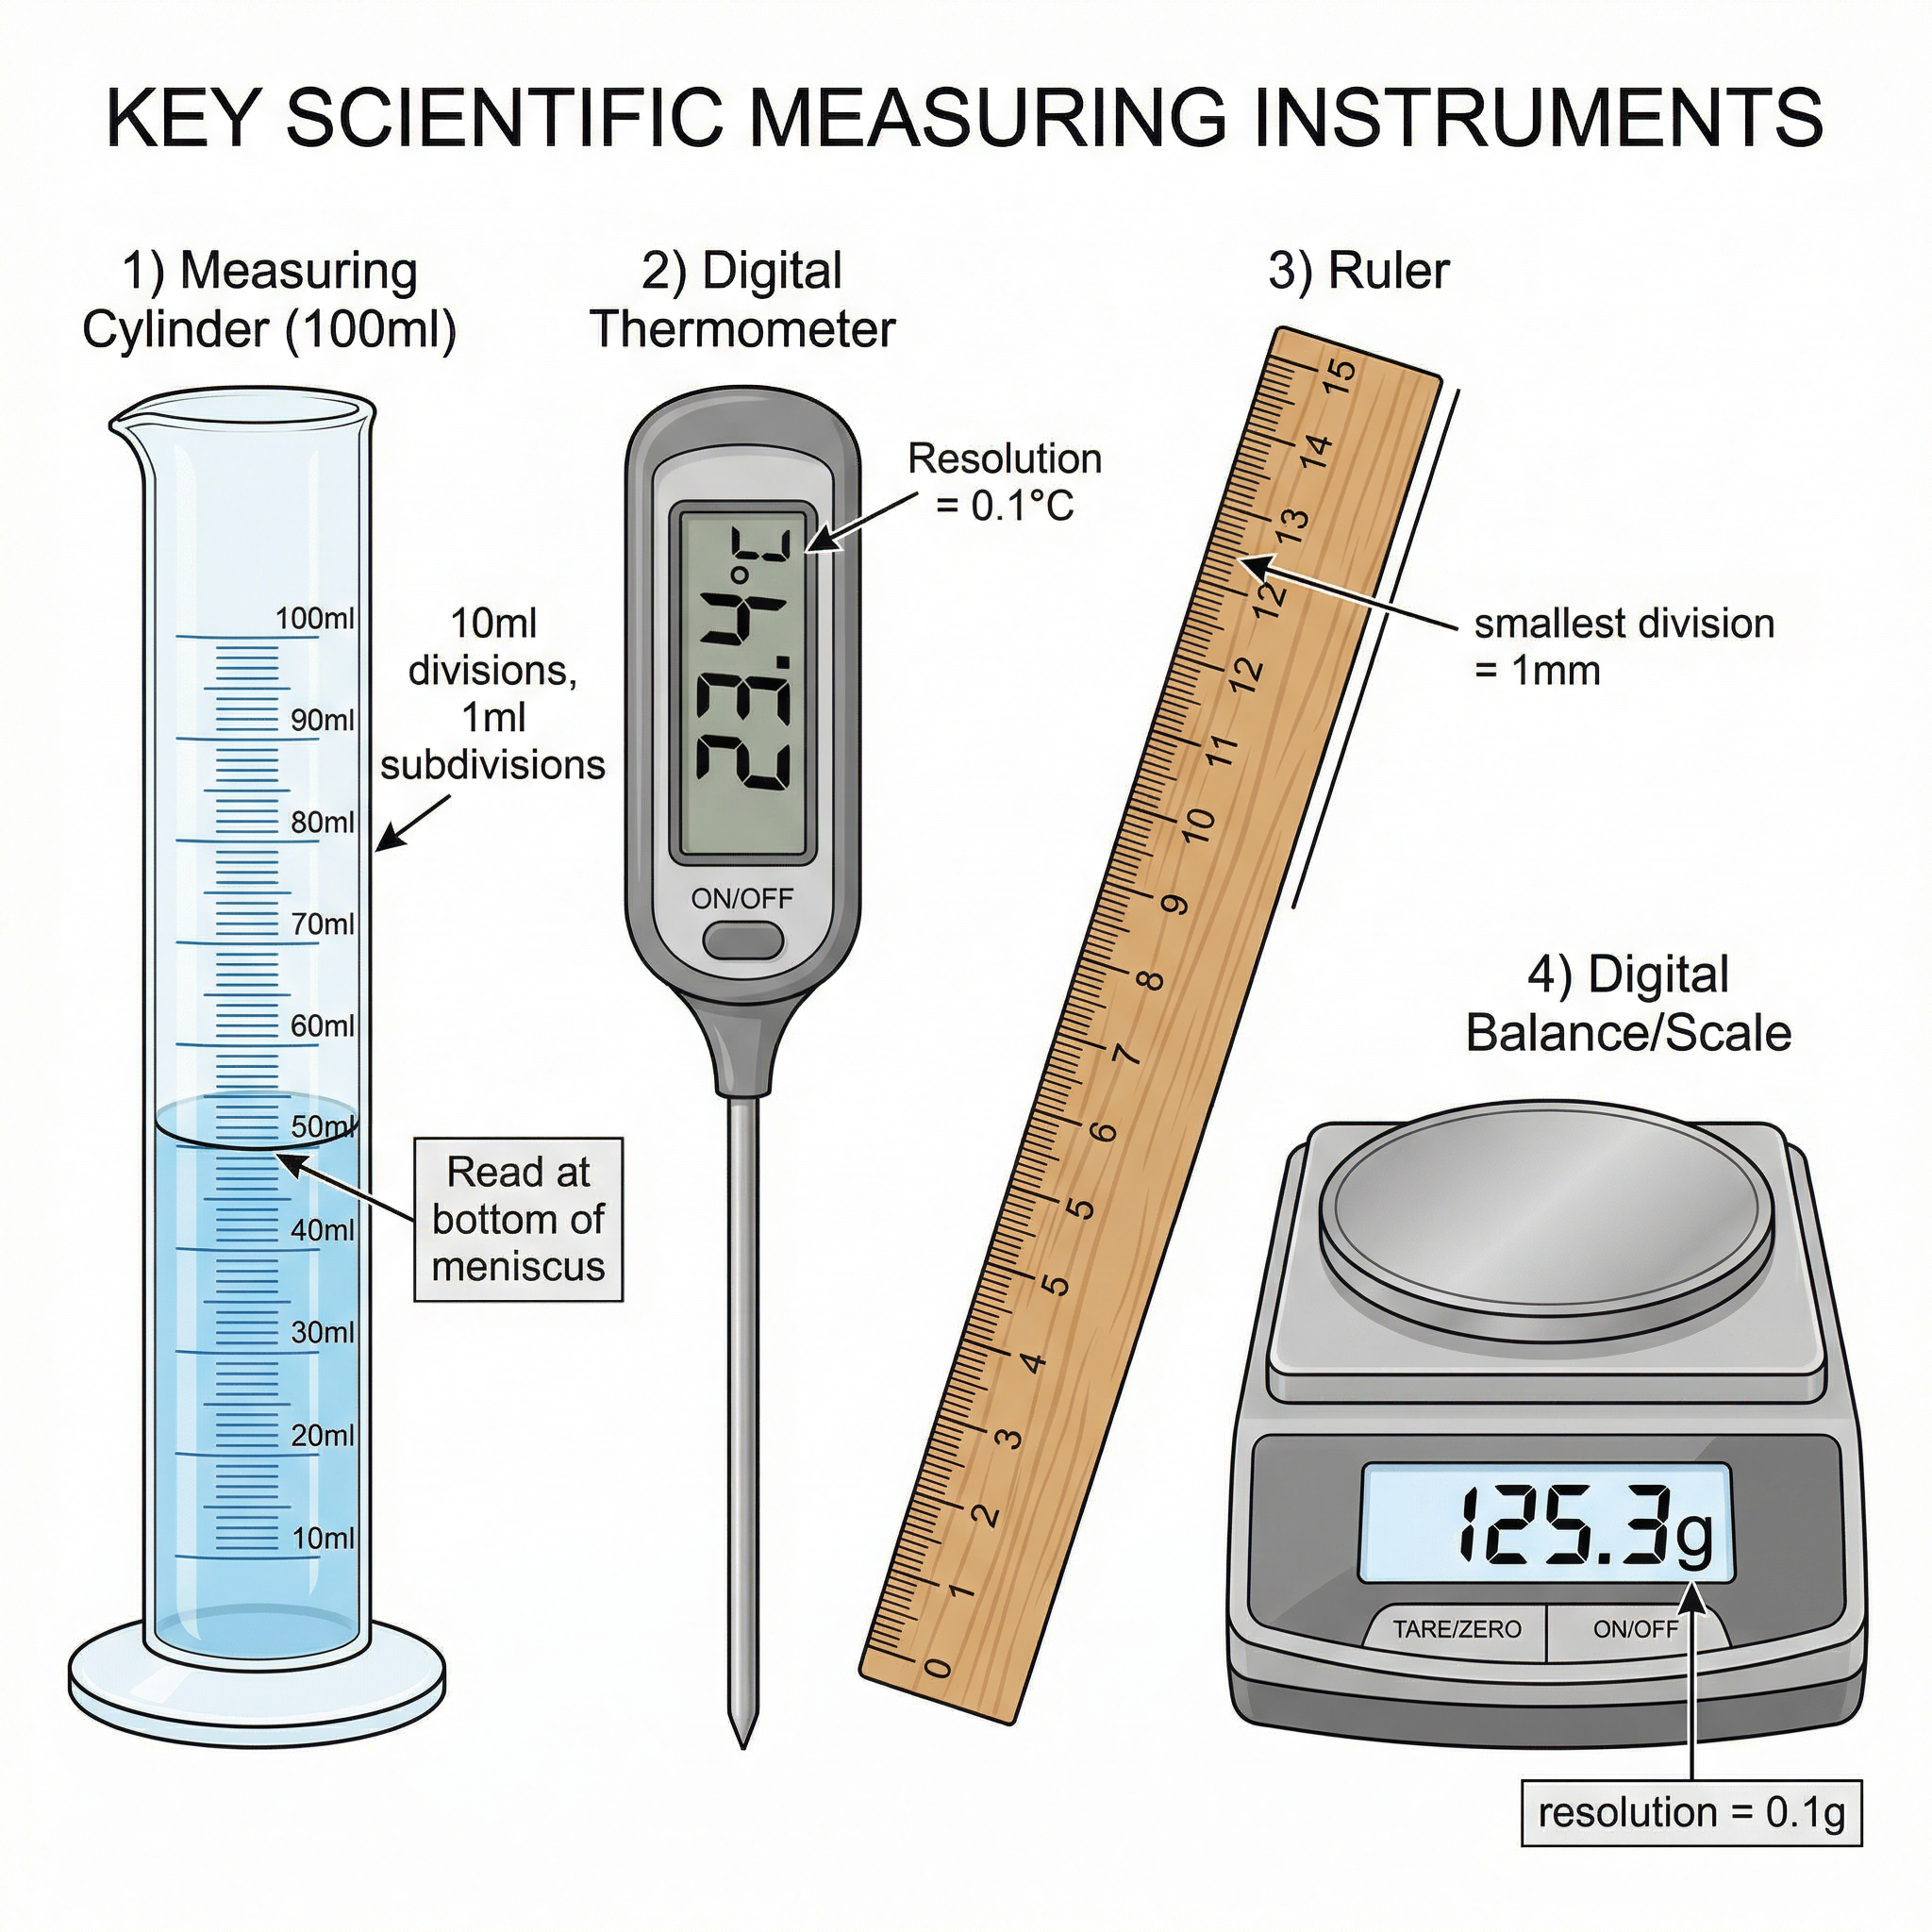
The first step in any experiment is selecting the right tool for the job. Examiners expect you to choose apparatus with an appropriate resolution. Resolution is the smallest change in the quantity being measured that gives a perceptible change in the reading. For example, a ruler with millimetre markings has a resolution of 1 mm. A digital stopwatch that measures to two decimal places (e.g., 12.58 s) has a resolution of 0.01 s.
Why it matters: Using an instrument with a higher resolution generally leads to more precise results. AQA will award marks for choosing the most appropriate instrument. For example, using a 10 cm³ measuring cylinder to measure 8 cm³ of liquid is better than using a 100 cm³ cylinder, as the scale is finer.
Example: To measure the 2 cm³ of acid, a 5 cm³ measuring cylinder is more appropriate than a 50 cm³ beaker. The smaller cylinder has a higher resolution, reducing the percentage uncertainty of the measurement.
Concept 2: Recording Data and Constructing Tables
This is a core skill that is frequently tested. A well-constructed table is essential for presenting your results clearly and professionally. There are strict rules that examiners look for.
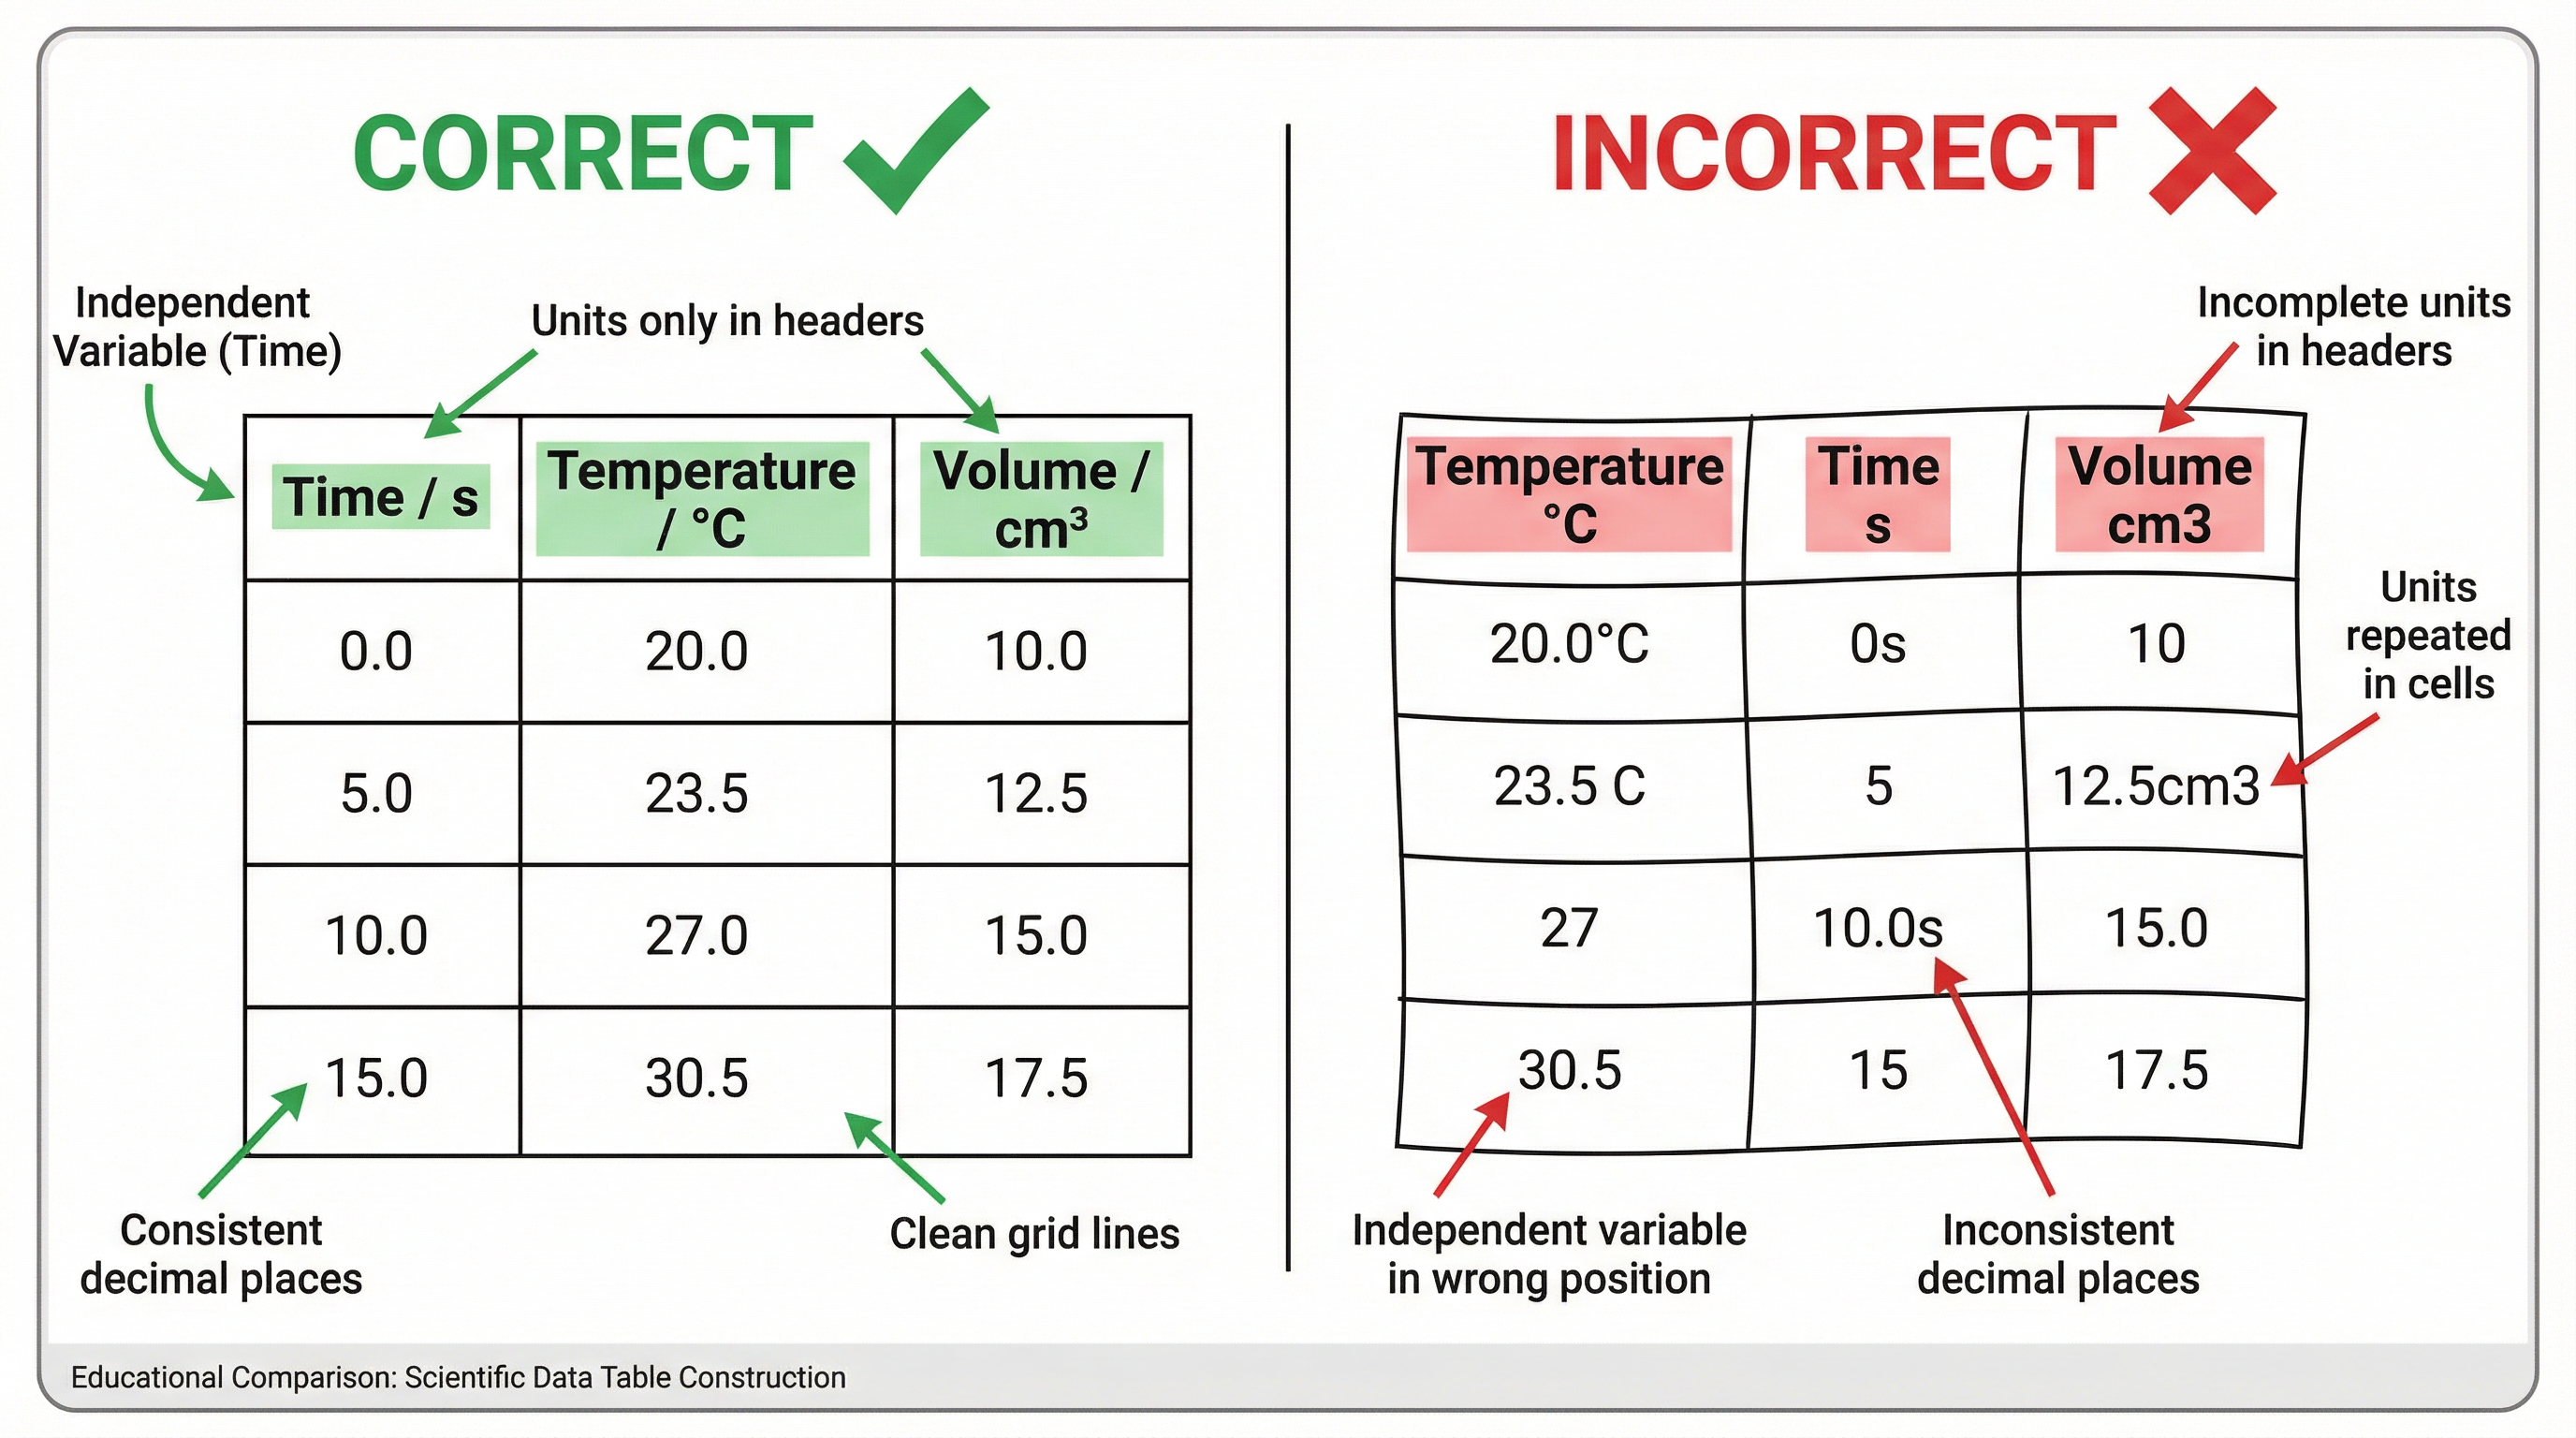
- Structure: The independent variable (the one you change) ALWAYS goes in the first column. The dependent variable (the one you measure) goes in the subsequent columns.
- Headers: Each column must have a clear header stating the quantity and the unit, separated by a solidus (/). For example,
Time / sorTemperature / °C. - Units: Units belong ONLY in the headers. Never, ever repeat them in the body of the table.
- Consistency: All data in a column must be recorded to the same number of decimal places, and this should be consistent with the resolution of the measuring instrument. If your balance reads to two decimal places (e.g., 5.00 g), all your mass readings must be given to two decimal places.
Concept 3: Errors and Uncertainty
No measurement is perfect. Understanding the different types of errors is crucial for AO3 (analysis and evaluation) marks.
- Systematic Errors: These are errors that are consistent and repeatable, usually caused by the apparatus or method. For example, a balance that isn't zeroed correctly will give every reading an extra 0.2 g. This affects the accuracy of the results (how close they are to the true value) but not necessarily the precision.
- Random Errors: These are unpredictable variations in measurements. They can be caused by human error (like inconsistent reaction time when using a stopwatch) or fluctuations in conditions. Random errors affect the precision of the results (how close repeat readings are to each other). You can reduce the effect of random errors by taking multiple readings and calculating a mean.
- Zero Errors: A specific type of systematic error where an instrument gives a reading when the true value is zero. For example, a ruler with a worn end might start at 0.1 cm instead of 0.0 cm.
Concept 4: Calculating Means and Identifying Anomalies
To improve the reliability of your results, you should carry out repeat measurements. From these, you calculate a mean (average). However, before you do this, you must identify and exclude any anomalous results – readings that do not fit the pattern of the others. Examiners will explicitly award a mark for this.
Example: A student records the time taken for a reaction: 25.2 s, 25.9 s, 25.5 s, 31.2 s.
- Identify Anomaly: The result 31.2 s is anomalous as it is much higher than the others.
- Calculate Mean: (25.2 + 25.9 + 25.5) / 3 = 76.6 / 3 = 25.533... s.
- Record to appropriate significant figures: The raw data is to 1 decimal place, so the mean should be given to a similar precision, e.g., 25.5 s. Credit is often given for this.
Mathematical/Scientific Relationships
Calculating the Mean
- Formula: Mean = Sum of repeat readings / Number of repeat readings
- Status: Must memorise.
- Important: Always exclude anomalies before calculating.
Calculating Percentage Uncertainty
- Formula: Percentage Uncertainty = (Uncertainty / Measurement) x 100
- Status: Higher Tier Only. Given on the formula sheet.
- Uncertainty: For a single reading, the uncertainty is usually taken as half the resolution. For example, a ruler with 1 mm resolution has an uncertainty of ±0.5 mm.
Practical Applications
These skills are fundamental to all 21 AQA Required Practicals. For example, in the practical investigating the effect of temperature on enzyme activity, you will need to:
- Measure temperature with a thermometer (e.g., to 0.5 °C).
- Measure time with a stopwatch (e.g., to 0.01 s).
- Record these values in a correctly formatted table.
- Calculate the rate of reaction (e.g., 1 / time).
- Plot a graph of rate against temperature.
- Evaluate the quality of your data, considering potential errors.