Study Notes

Overview
Interpreting business data is a fundamental skill for Edexcel GCSE Business (1BS0). It's not just about reading numbers; it's about understanding the story they tell about a business's performance, its position in the market, and its future prospects. Examiners are looking for candidates who can move beyond simple descriptions (AO1) to perform calculations (AO2) and, crucially, analyse the data in context to explain its consequences and support judgements (AO3). This involves handling both quantitative (numerical) and qualitative (descriptive) data, from financial statements to customer feedback. A strong response will always link the data directly to the specific business in the case study, explaining the implications of the trends and figures identified. For example, simply stating 'sales have increased' will earn minimal credit. A top-level response would state, 'The 15% increase in sales revenue for business X in the last quarter, likely driven by their recent social media campaign, will increase their gross profit, allowing for greater potential reinvestment into stock.
Key Data Types
Quantitative Data
What it is: Numerical data that can be measured. This is the backbone of business decision-making.
Why it matters: It provides objective, measurable evidence of performance. Examiners expect you to be confident in calculating and interpreting this data.
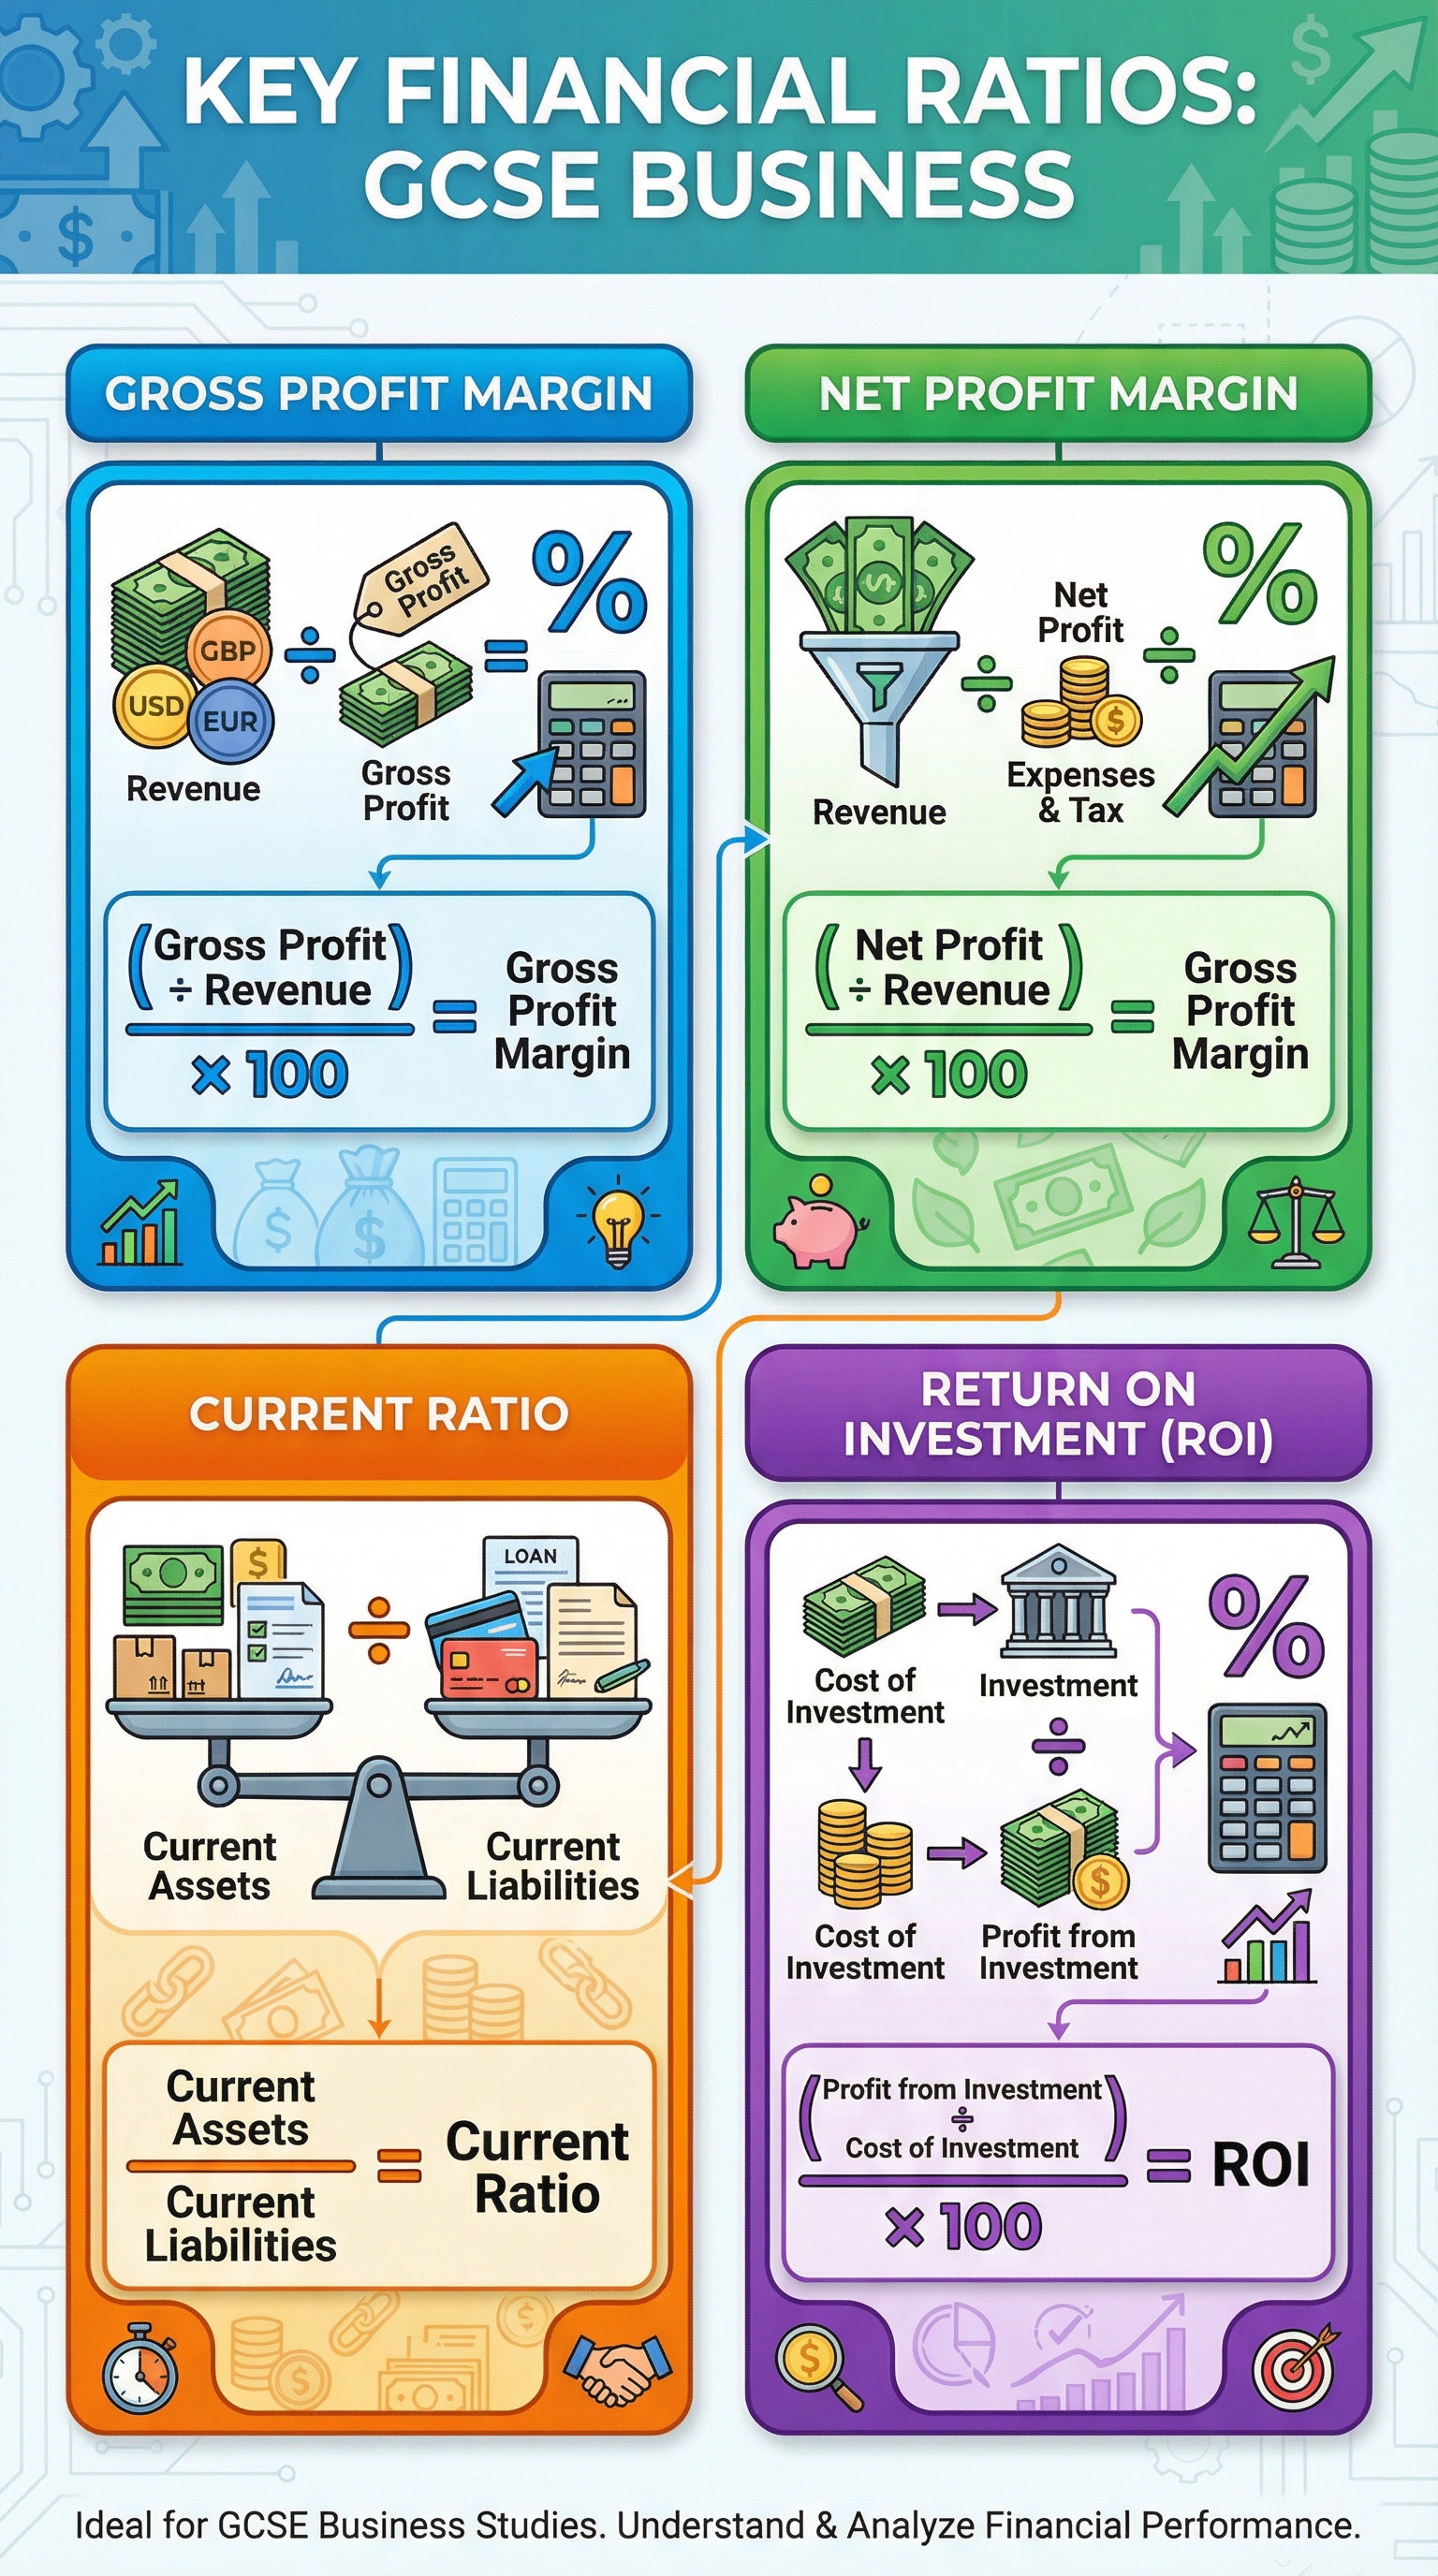
Specific Knowledge: You must know key financial data points like Revenue, Cost of Sales, Gross Profit, and Net Profit. You also need to be fluent in calculating and interpreting financial ratios and understanding data presented in charts and graphs.
Qualitative Data
What it is: Descriptive, non-numerical data, often based on opinions, attitudes, and beliefs.
Why it matters: It provides the 'why' behind the numbers. It can reveal customer satisfaction, brand perception, and market trends that numbers alone cannot.
Specific Knowledge: Examples include customer comments, focus group transcripts, and interview responses. When using qualitative data, examiners want you to consider its reliability – is it just one person's opinion, or a representative view? This shows evaluative skill.
Second-Order Concepts
Causation
Data interpretation is about finding the cause behind a trend. If profit has fallen, was it due to rising costs (internal cause) or a new competitor (external cause)? Your analysis must connect the 'what' with the 'why'.
Consequence
Once you've identified a trend, you must explain its effect on the business. A falling Gross Profit Margin has the consequence of reducing the funds available for paying expenses, which could threaten the business's net profitability and long-term survival.
Change & Continuity
Track data over time. Has performance improved, worsened, or stayed the same? A single data point is a snapshot; a series of data points reveals a trend, which is far more useful for analysis and is a skill examiners reward.
Significance
How important is a piece of data? A 2% increase in sales for a multi-million-pound business is highly significant in monetary terms, whereas a 50% increase for a small start-up might be less significant in absolute terms but shows a strong growth trajectory. You must assess the data's importance in the given context.
Source Skills
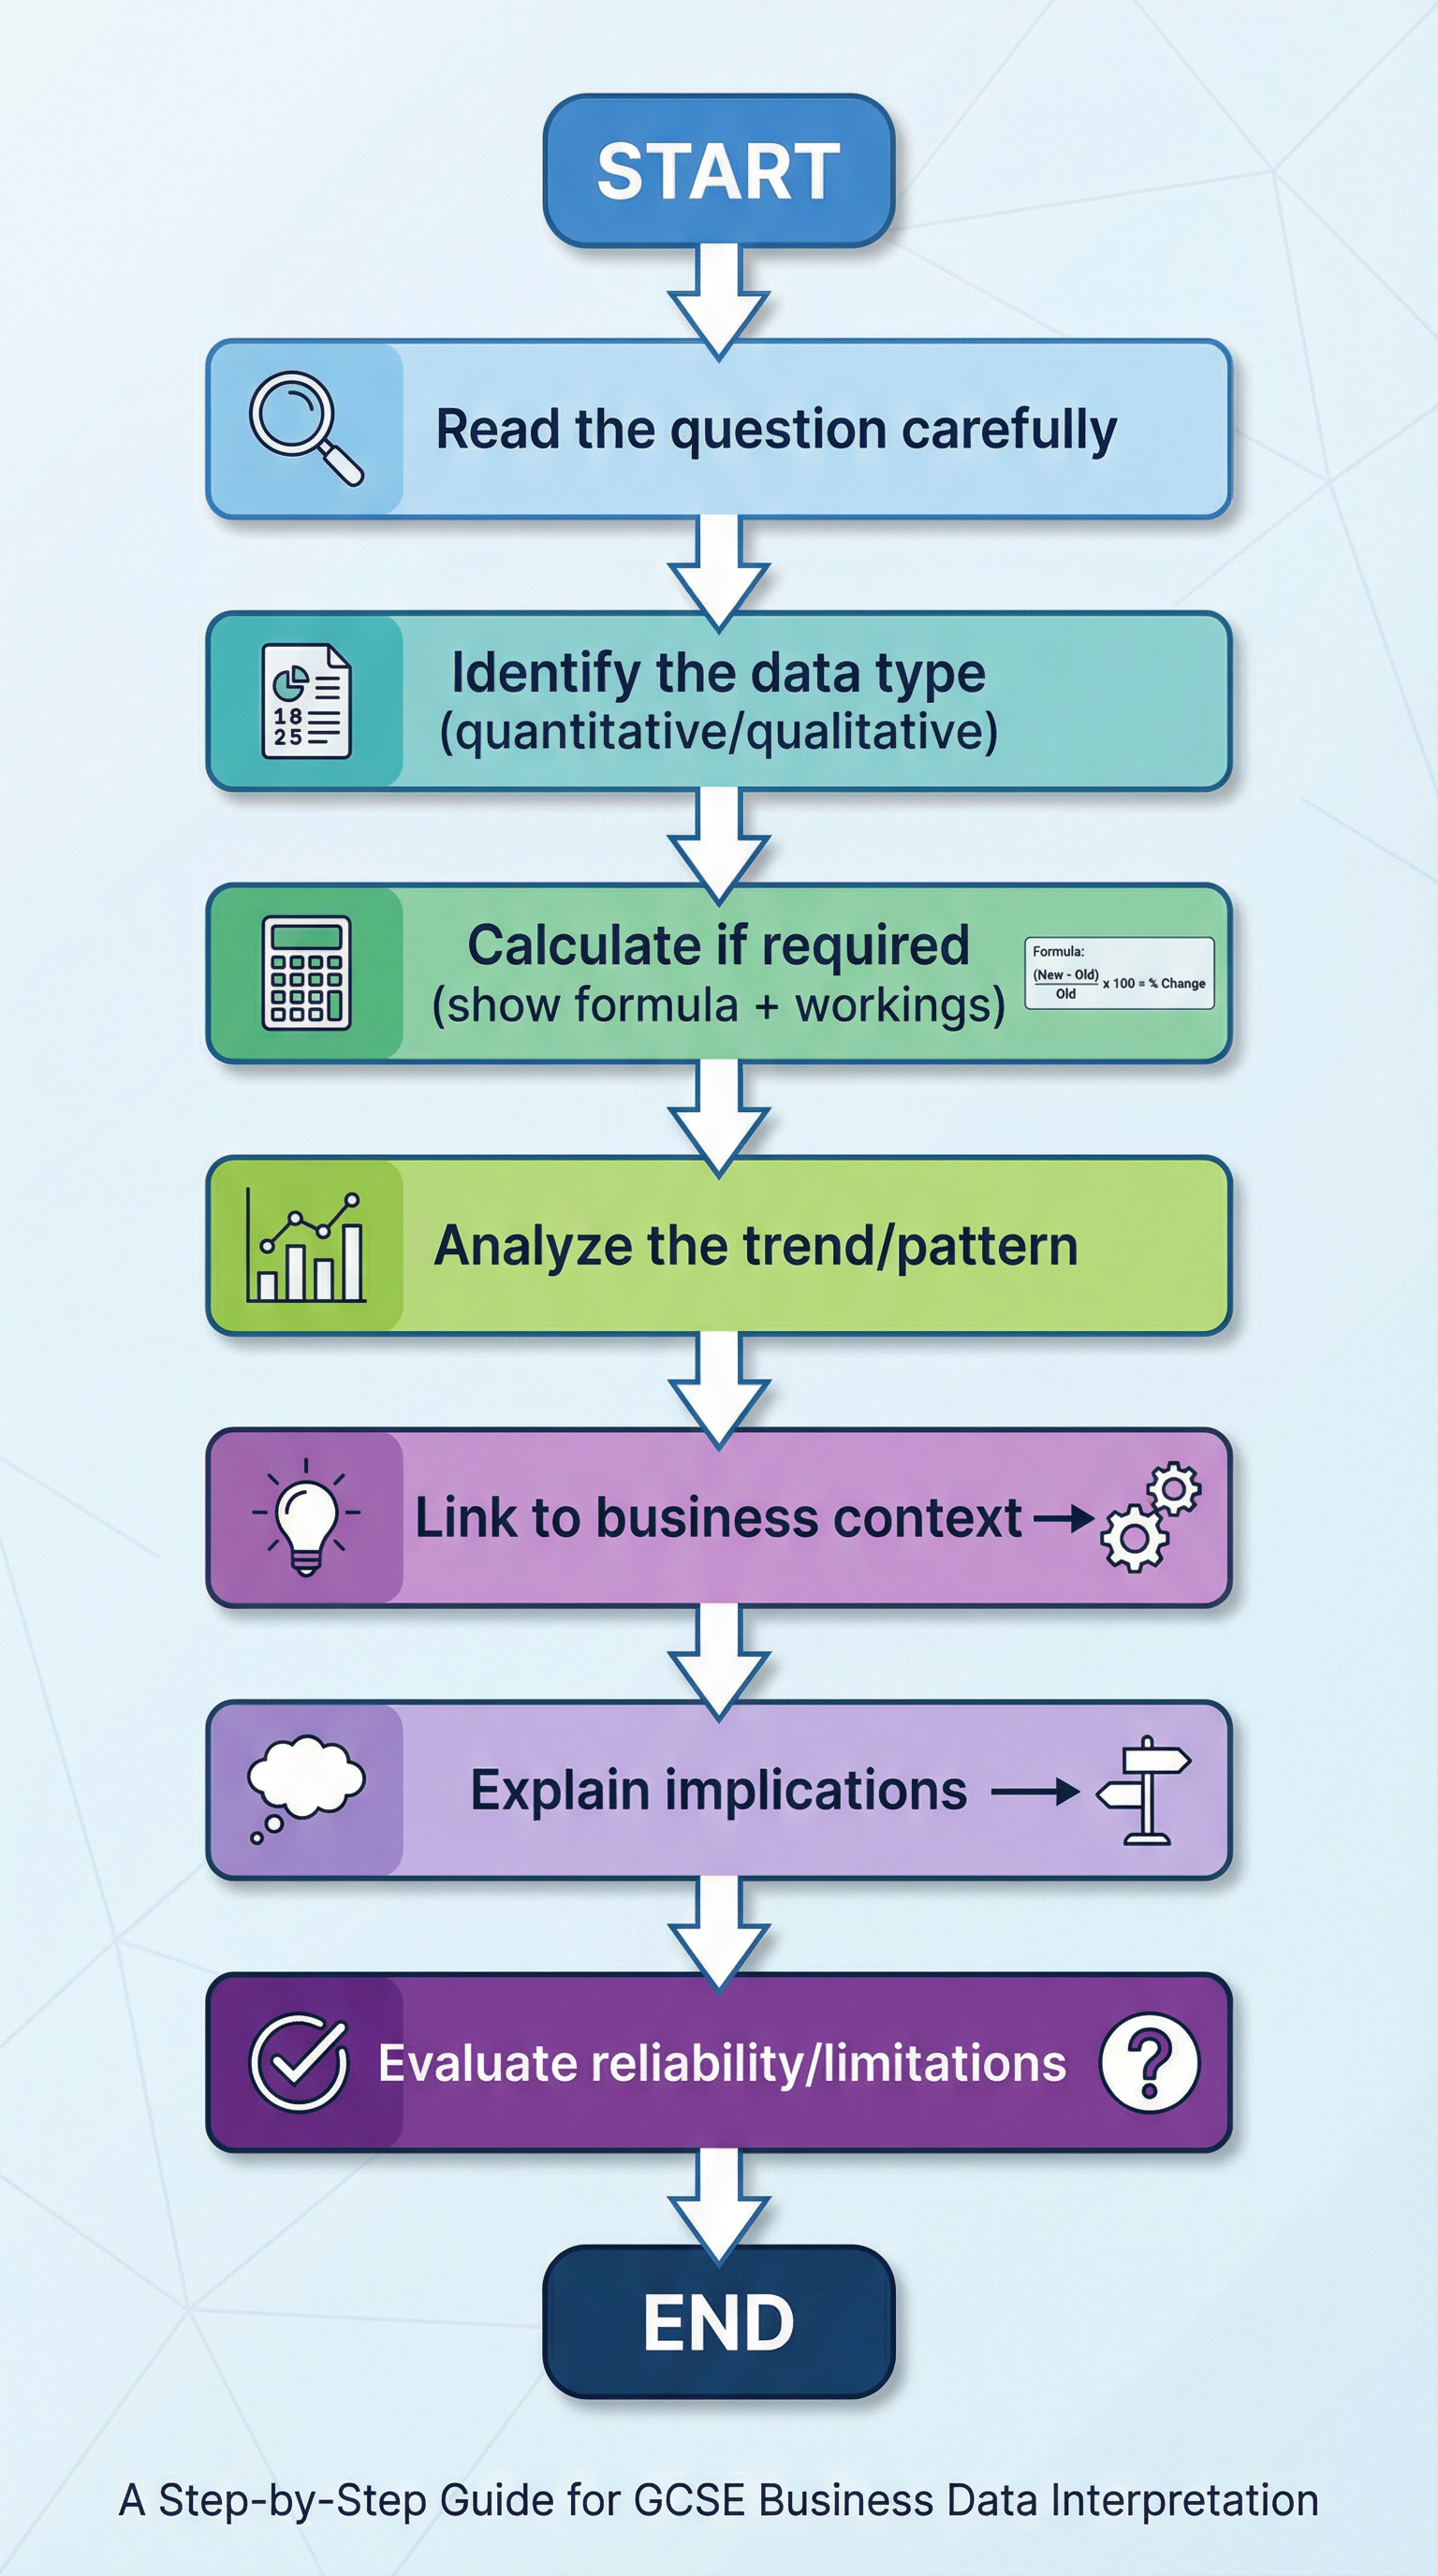
When presented with a chart, table, or graph, use the following approach:
- Identify: What does the source show? What are the units? What is the time period?
- Calculate: Are there any calculations you can perform? Percentage changes, differences, or key ratios?
- Analyse: What is the main trend or pattern? Are there any anomalies?
- Contextualise: How does this data relate to the business in the case study? What does it mean for them?
- Evaluate: How reliable is this data? Is the sample size mentioned? Is it recent? This is crucial for hitting the top marks in evaluation questions.