
Study Notes

Overview
Data interpretation is a cornerstone of the OCR J204 Business specification, accounting for a significant portion of your final grade. Examiners are not just looking for candidates who can perform calculations; they are seeking students who can act as business consultants. This means taking raw data from financial statements, market research tables, and operational charts, and using it to build a logical chain of reasoning. You must be able to identify trends, calculate key metrics, and, most importantly, explain what this data means for a business's performance and its future strategy. This guide will equip you with the analytical frameworks and exam techniques needed to move beyond simple descriptions and provide the insightful, evidence-based judgements that are awarded the highest marks.
Key Concepts & Calculations
1. Financial Data Analysis
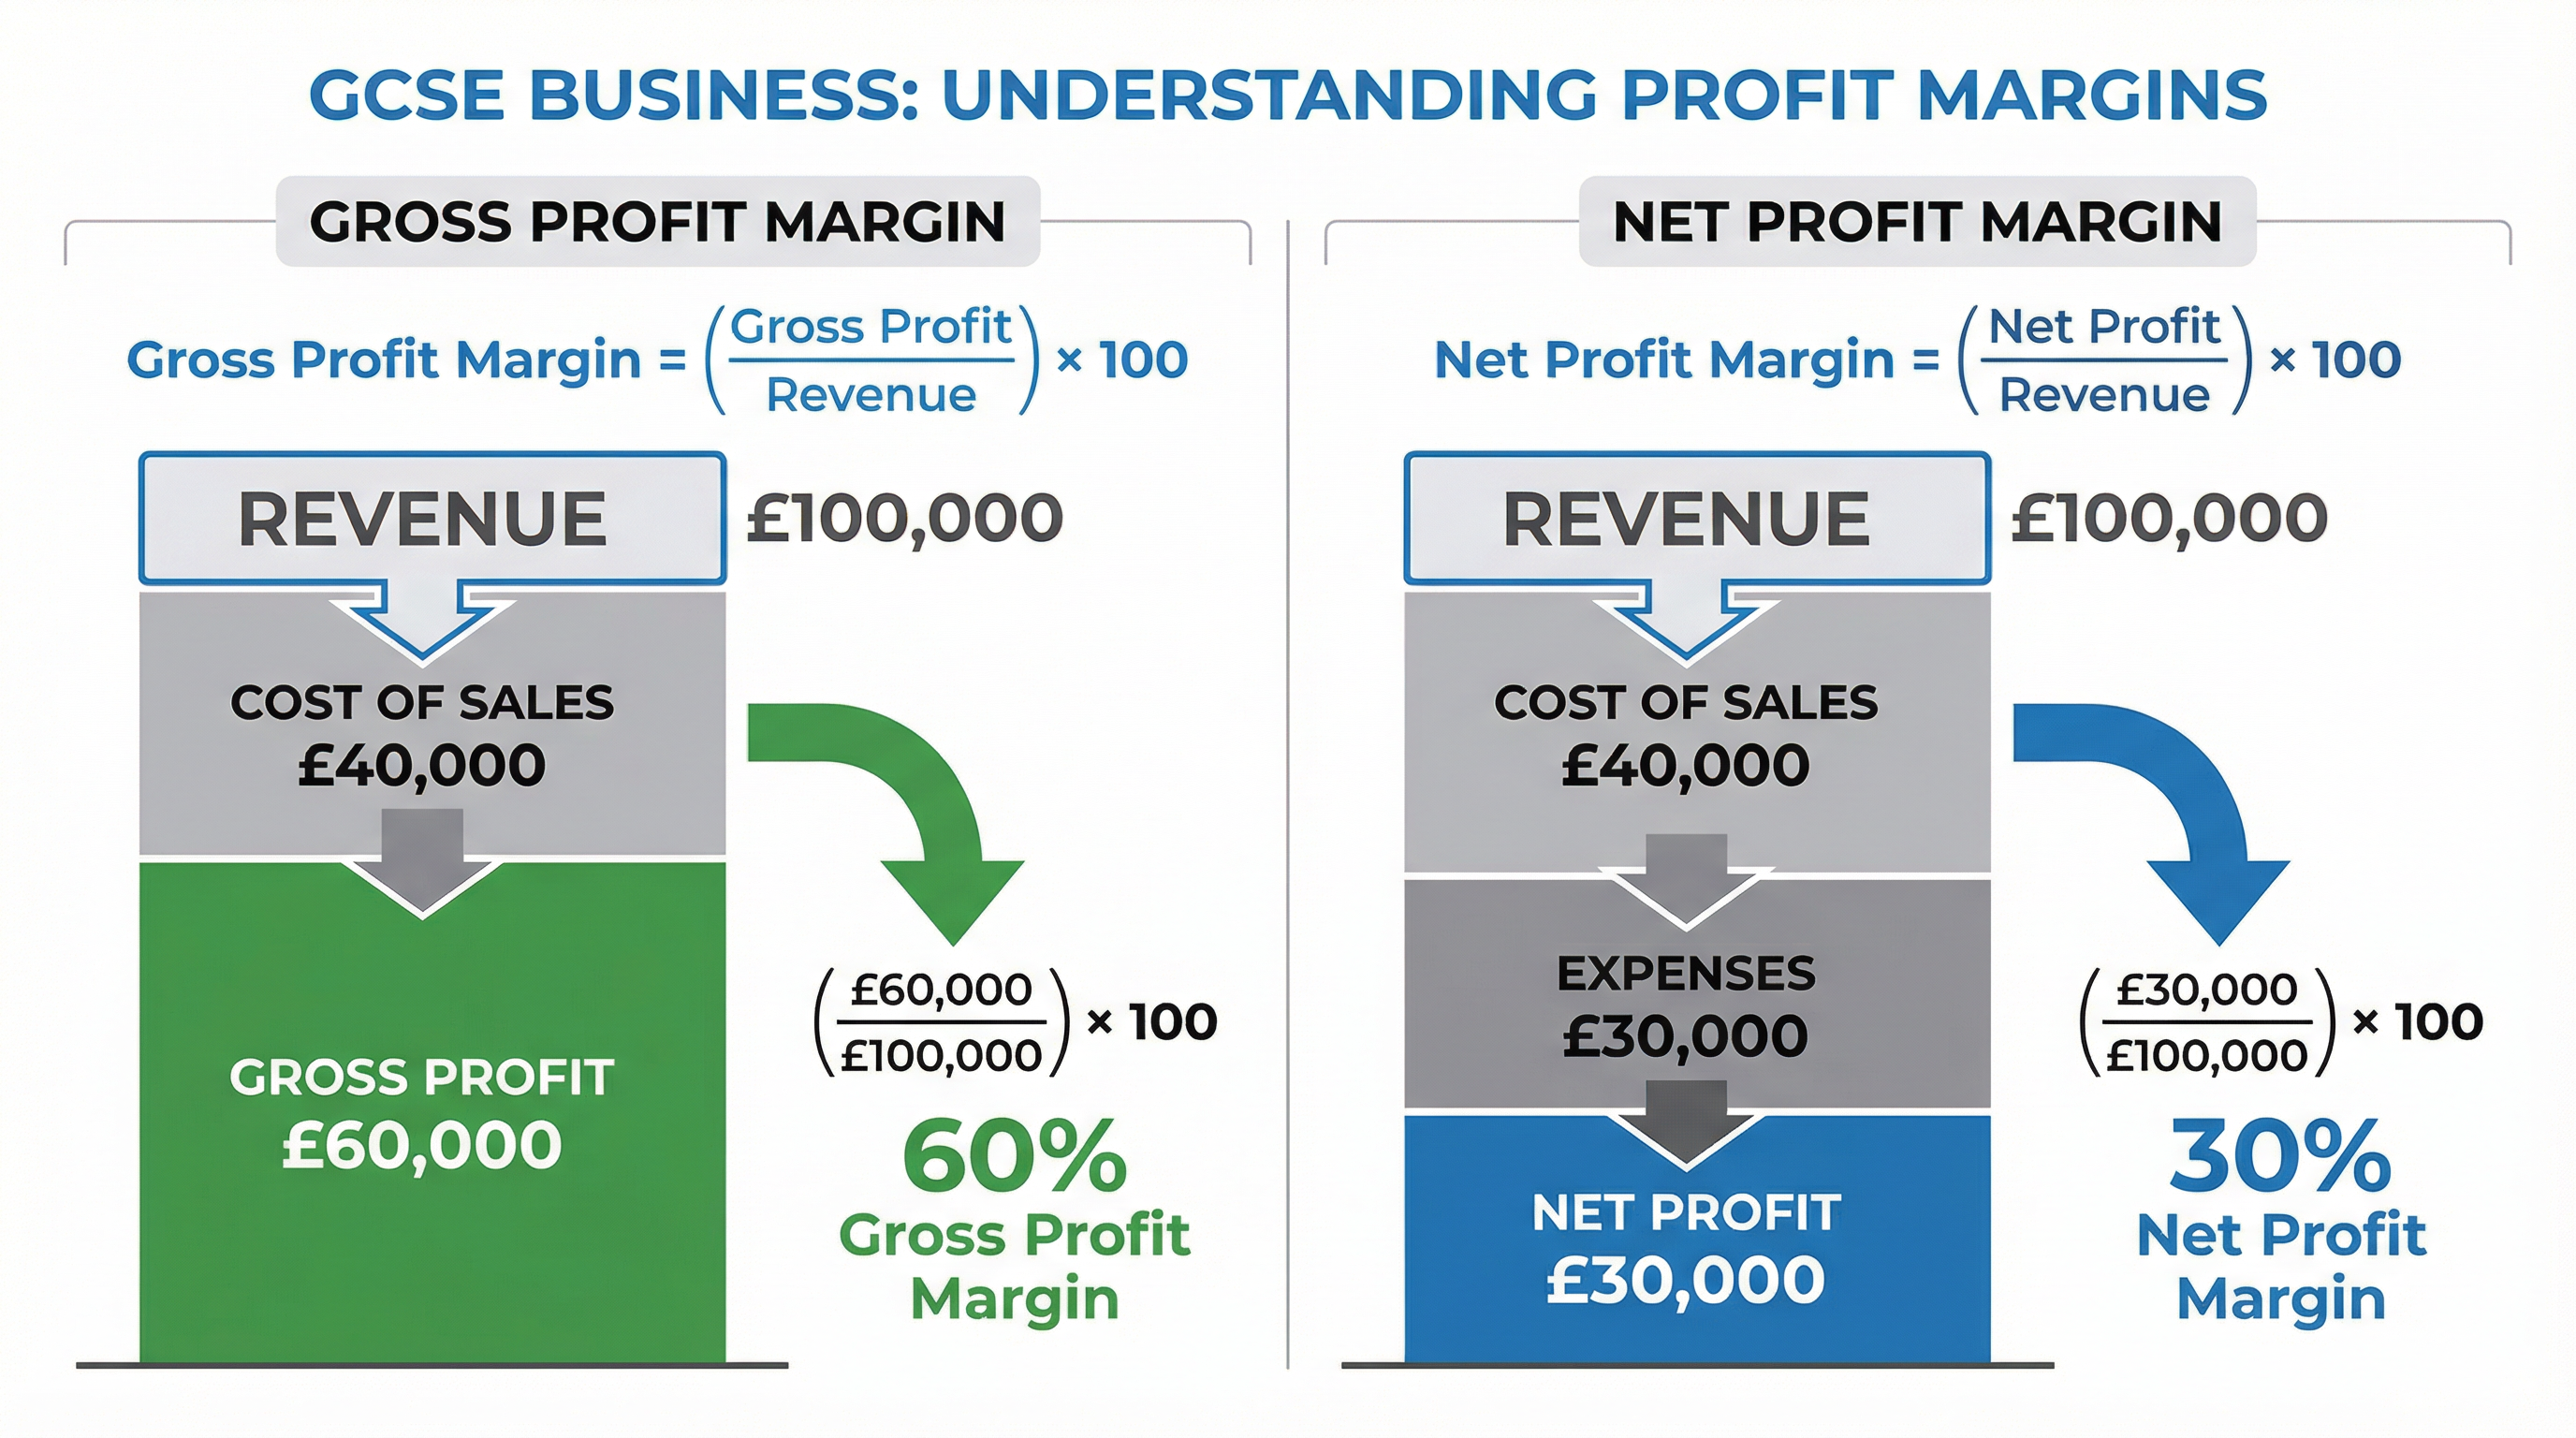
What it is: The process of reviewing a business's financial statements (like the Profit and Loss Statement and Cash Flow Forecast) to make better economic decisions. It involves calculating and interpreting key ratios to assess profitability, liquidity, and efficiency.
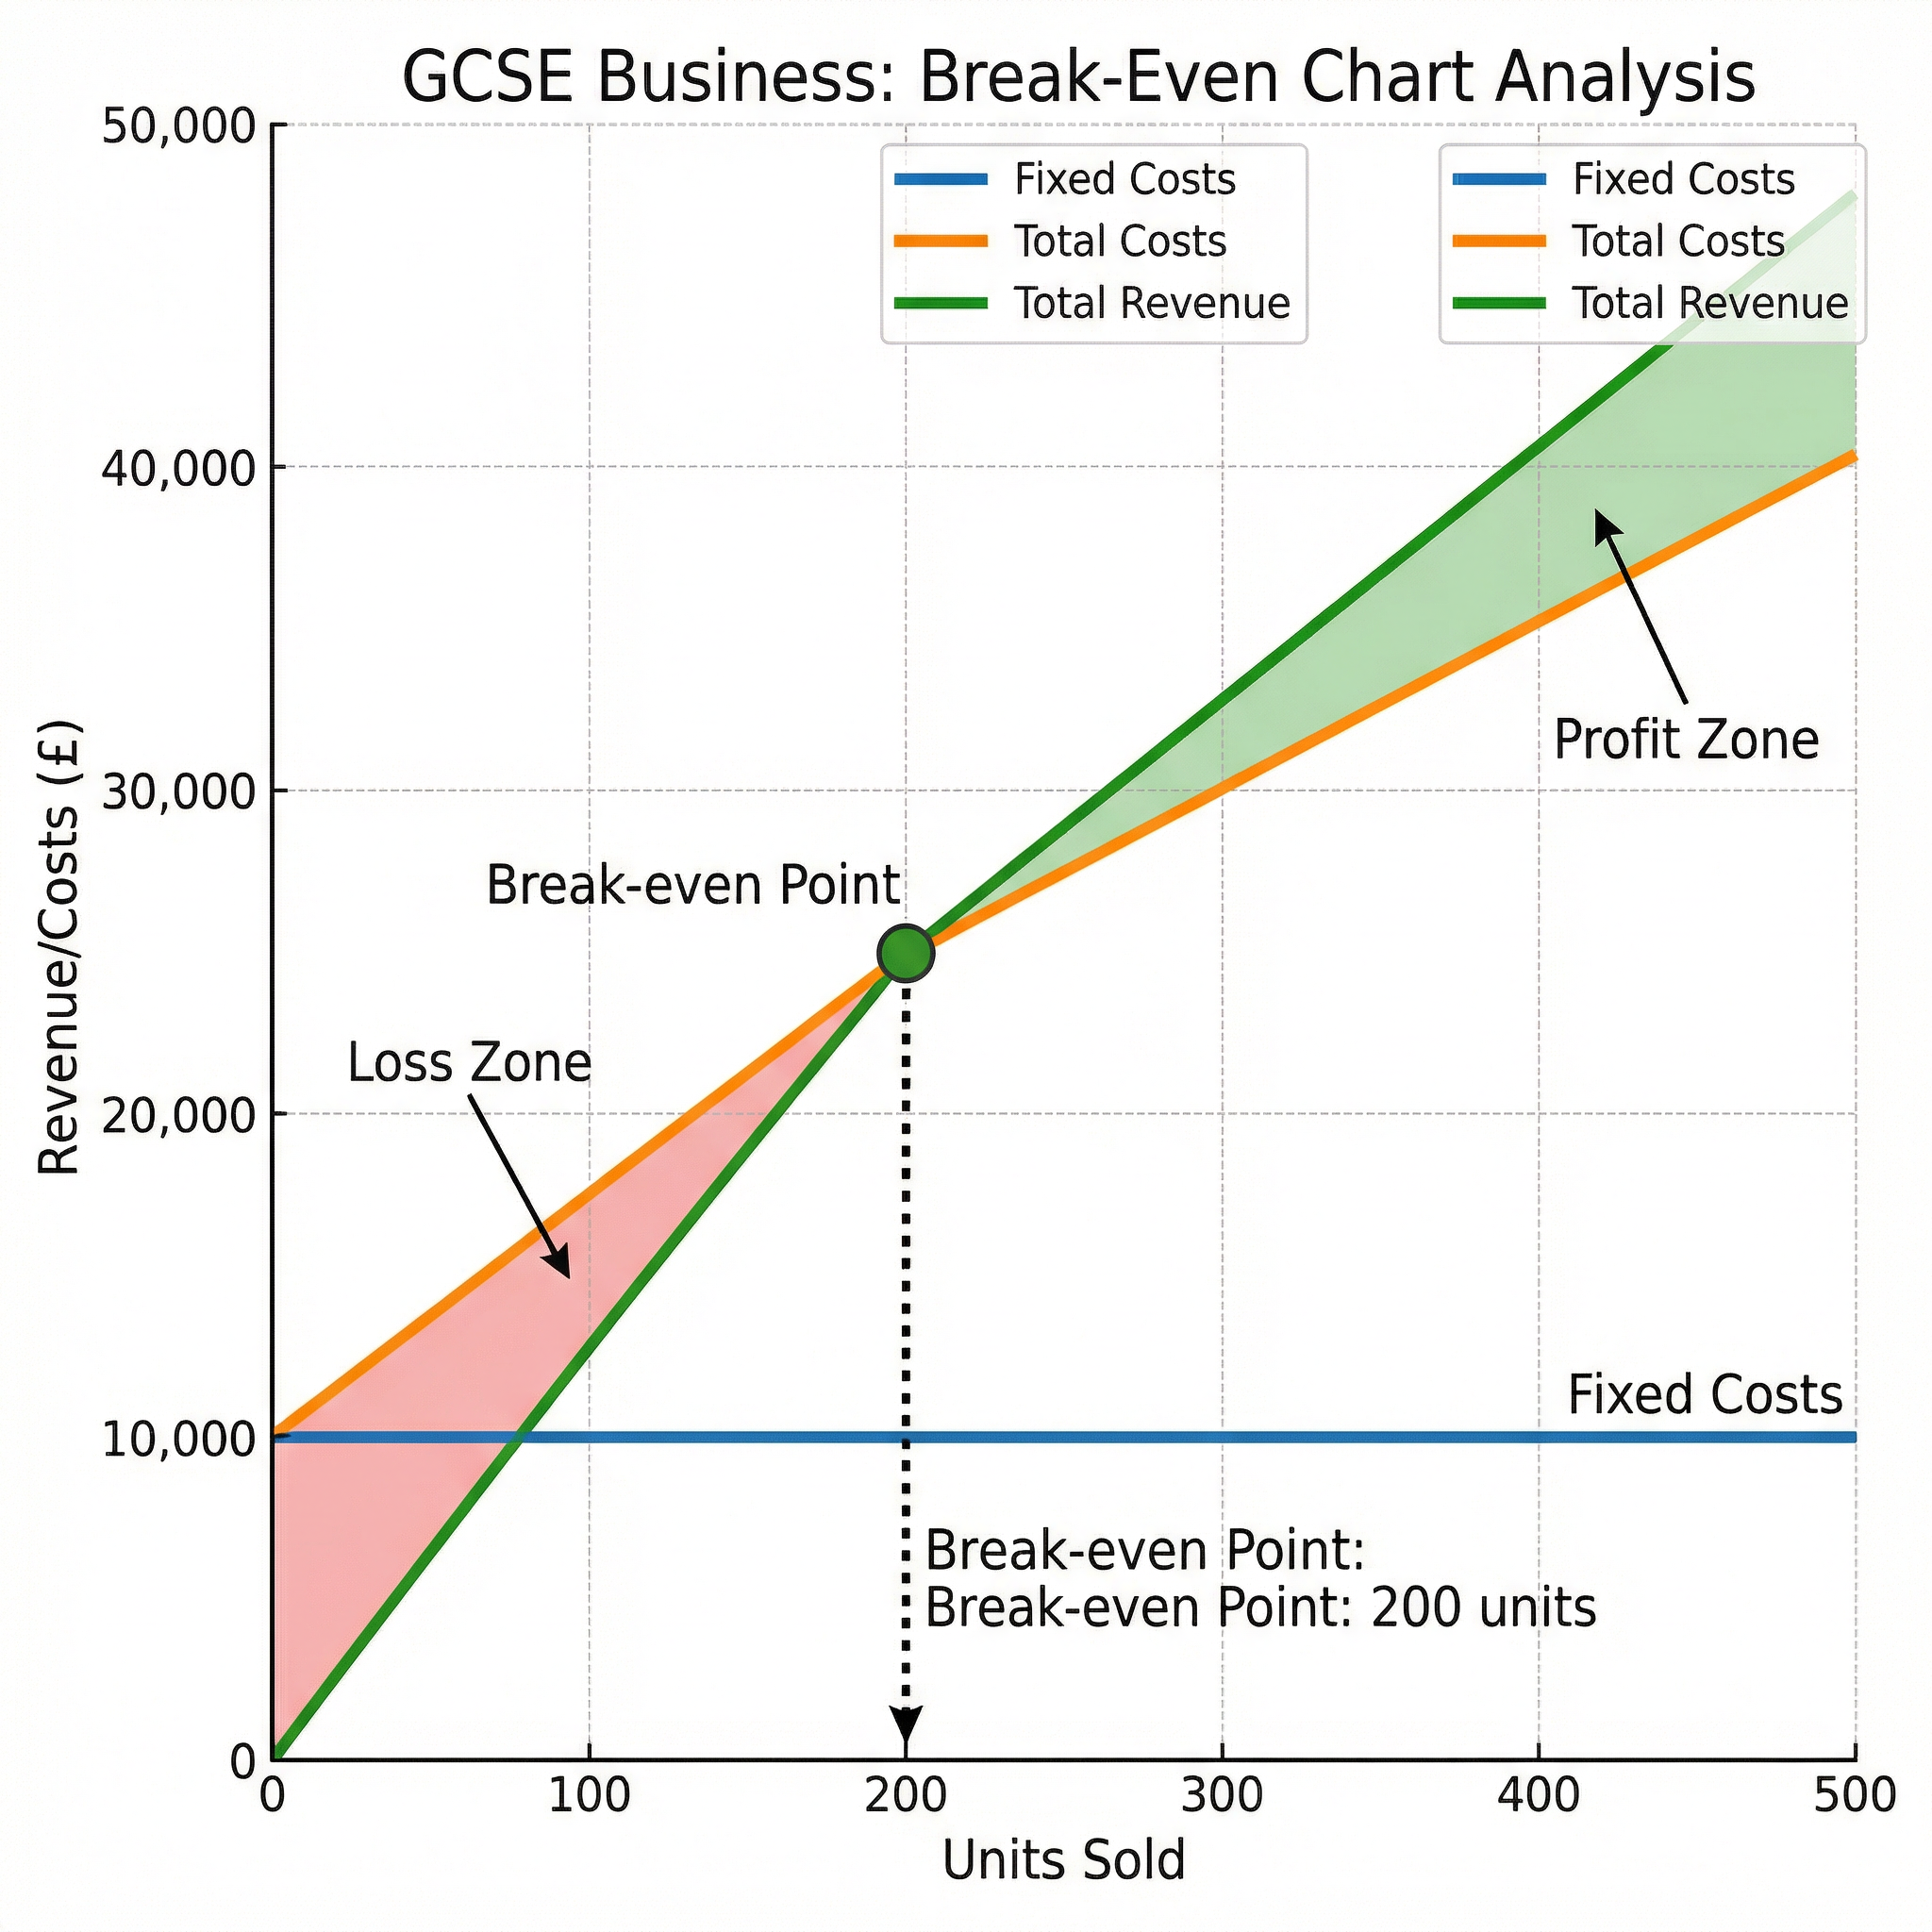
Why it matters: This is the language of business performance. Being able to calculate and interpret Gross Profit Margin, Net Profit Margin, and Break-Even is non-negotiable for a high grade. Examiners expect you to use these calculations to justify your recommendations.
Specific Knowledge: You must know the following formulae by heart:
- Gross Profit = Revenue - Cost of Sales
- Net Profit = Gross Profit - Other Operating Expenses and Interest
- Gross Profit Margin (%) = (Gross Profit / Revenue) x 100
- Net Profit Margin (%) = (Net Profit / Revenue) x 100
- Break-Even Point (in units) = Fixed Costs / (Selling Price per unit - Variable Cost per unit)
2. Market & Sales Data
What it is: Analyzing data related to sales, market share, and customer demographics. This often comes in the form of charts, graphs, and tables within the case study material.
Why it matters: This data provides context. A fall in Net Profit Margin is one thing, but if you can link it to a simultaneous fall in market share, you are demonstrating a much deeper understanding of the business's problems. It allows you to connect internal financial performance with external market dynamics.
Specific Knowledge: Be comfortable reading:
- Bar Charts: For comparing quantities across different categories (e.g., sales per region).
- Line Graphs: For showing trends over time (e.g., revenue growth over five years).
- Pie Charts: For showing proportions or market share.
3. Operational Data
What it is: Information about a business's production processes, such as productivity, capacity utilisation, and quality control metrics.
Why it matters: Operational data helps explain the 'why' behind the financial numbers. For example, a rising Cost of Sales might be explained by falling productivity data. Linking these different data sets is a hallmark of a top-level response.
Specific Knowledge: Understand concepts like:
- Labour Productivity: Output per employee over a period of time.
- Capacity Utilisation: The extent to which a business is using its production capacity.
Second-Order Concepts
Causation
Data trends are rarely isolated. A fall in profitability (the effect) could be caused by a new competitor entering the market (a cause), leading to price cuts. Your job is to connect these dots. Use phrases like "This was likely caused by..." or "A contributing factor to this trend is...".
Consequence
Every data point has an implication. A rising break-even point means the business has become riskier, as it needs to sell more just to cover its costs. A falling Net Profit Margin could, in the long term, reduce the funds available for investment and innovation. Always ask: "So what?" What is the consequence of this number for the business?
Change & Continuity
Track data over time. Has the Gross Profit Margin been consistently low for years, or is this a recent change? A sudden change demands investigation and is often a great starting point for analysis. A long-term trend (continuity) might suggest a deep-seated strategic issue.
Significance
Which piece of data is most important? In a question asking you to recommend a course of action, you must decide which data point carries the most weight. Is a high-profit margin on a niche product more significant than a low-profit margin on a high-volume product? Justify your view.
Source Skills
When presented with a table or chart, apply the T.U.D.S. framework:
- T - Title: What is the source about? What is being measured?
- U - Units: Are the numbers in £, £000s, or £ms? Are they percentages? Getting this wrong can lose easy marks.
- D - Dates: What is the time frame? Is it a single year or a five-year trend?
- S - Scale: What is the range of the axes on a graph? Don't just say a line is going up; quantify the increase by reading the scale.