Study Notes

Overview
Data collection is a cornerstone of ecological study and a key part of the AQA GCSE Biology specification. This topic explores the scientific methods used to estimate the population size of a species (abundance) and to understand how species are spread out in a habitat (distribution). Mastering these techniques is not just about memorising methods; it's about understanding the core scientific principles of validity, reliability, and minimising bias. Examiners frequently test these concepts in the context of required practicals and data analysis questions, making it a vital area for securing marks in your final exams. This guide will equip you with the knowledge to confidently tackle questions on quadrats, transects, and population calculations.
Key Concepts
Concept 1: Sampling for Abundance (Random Sampling)
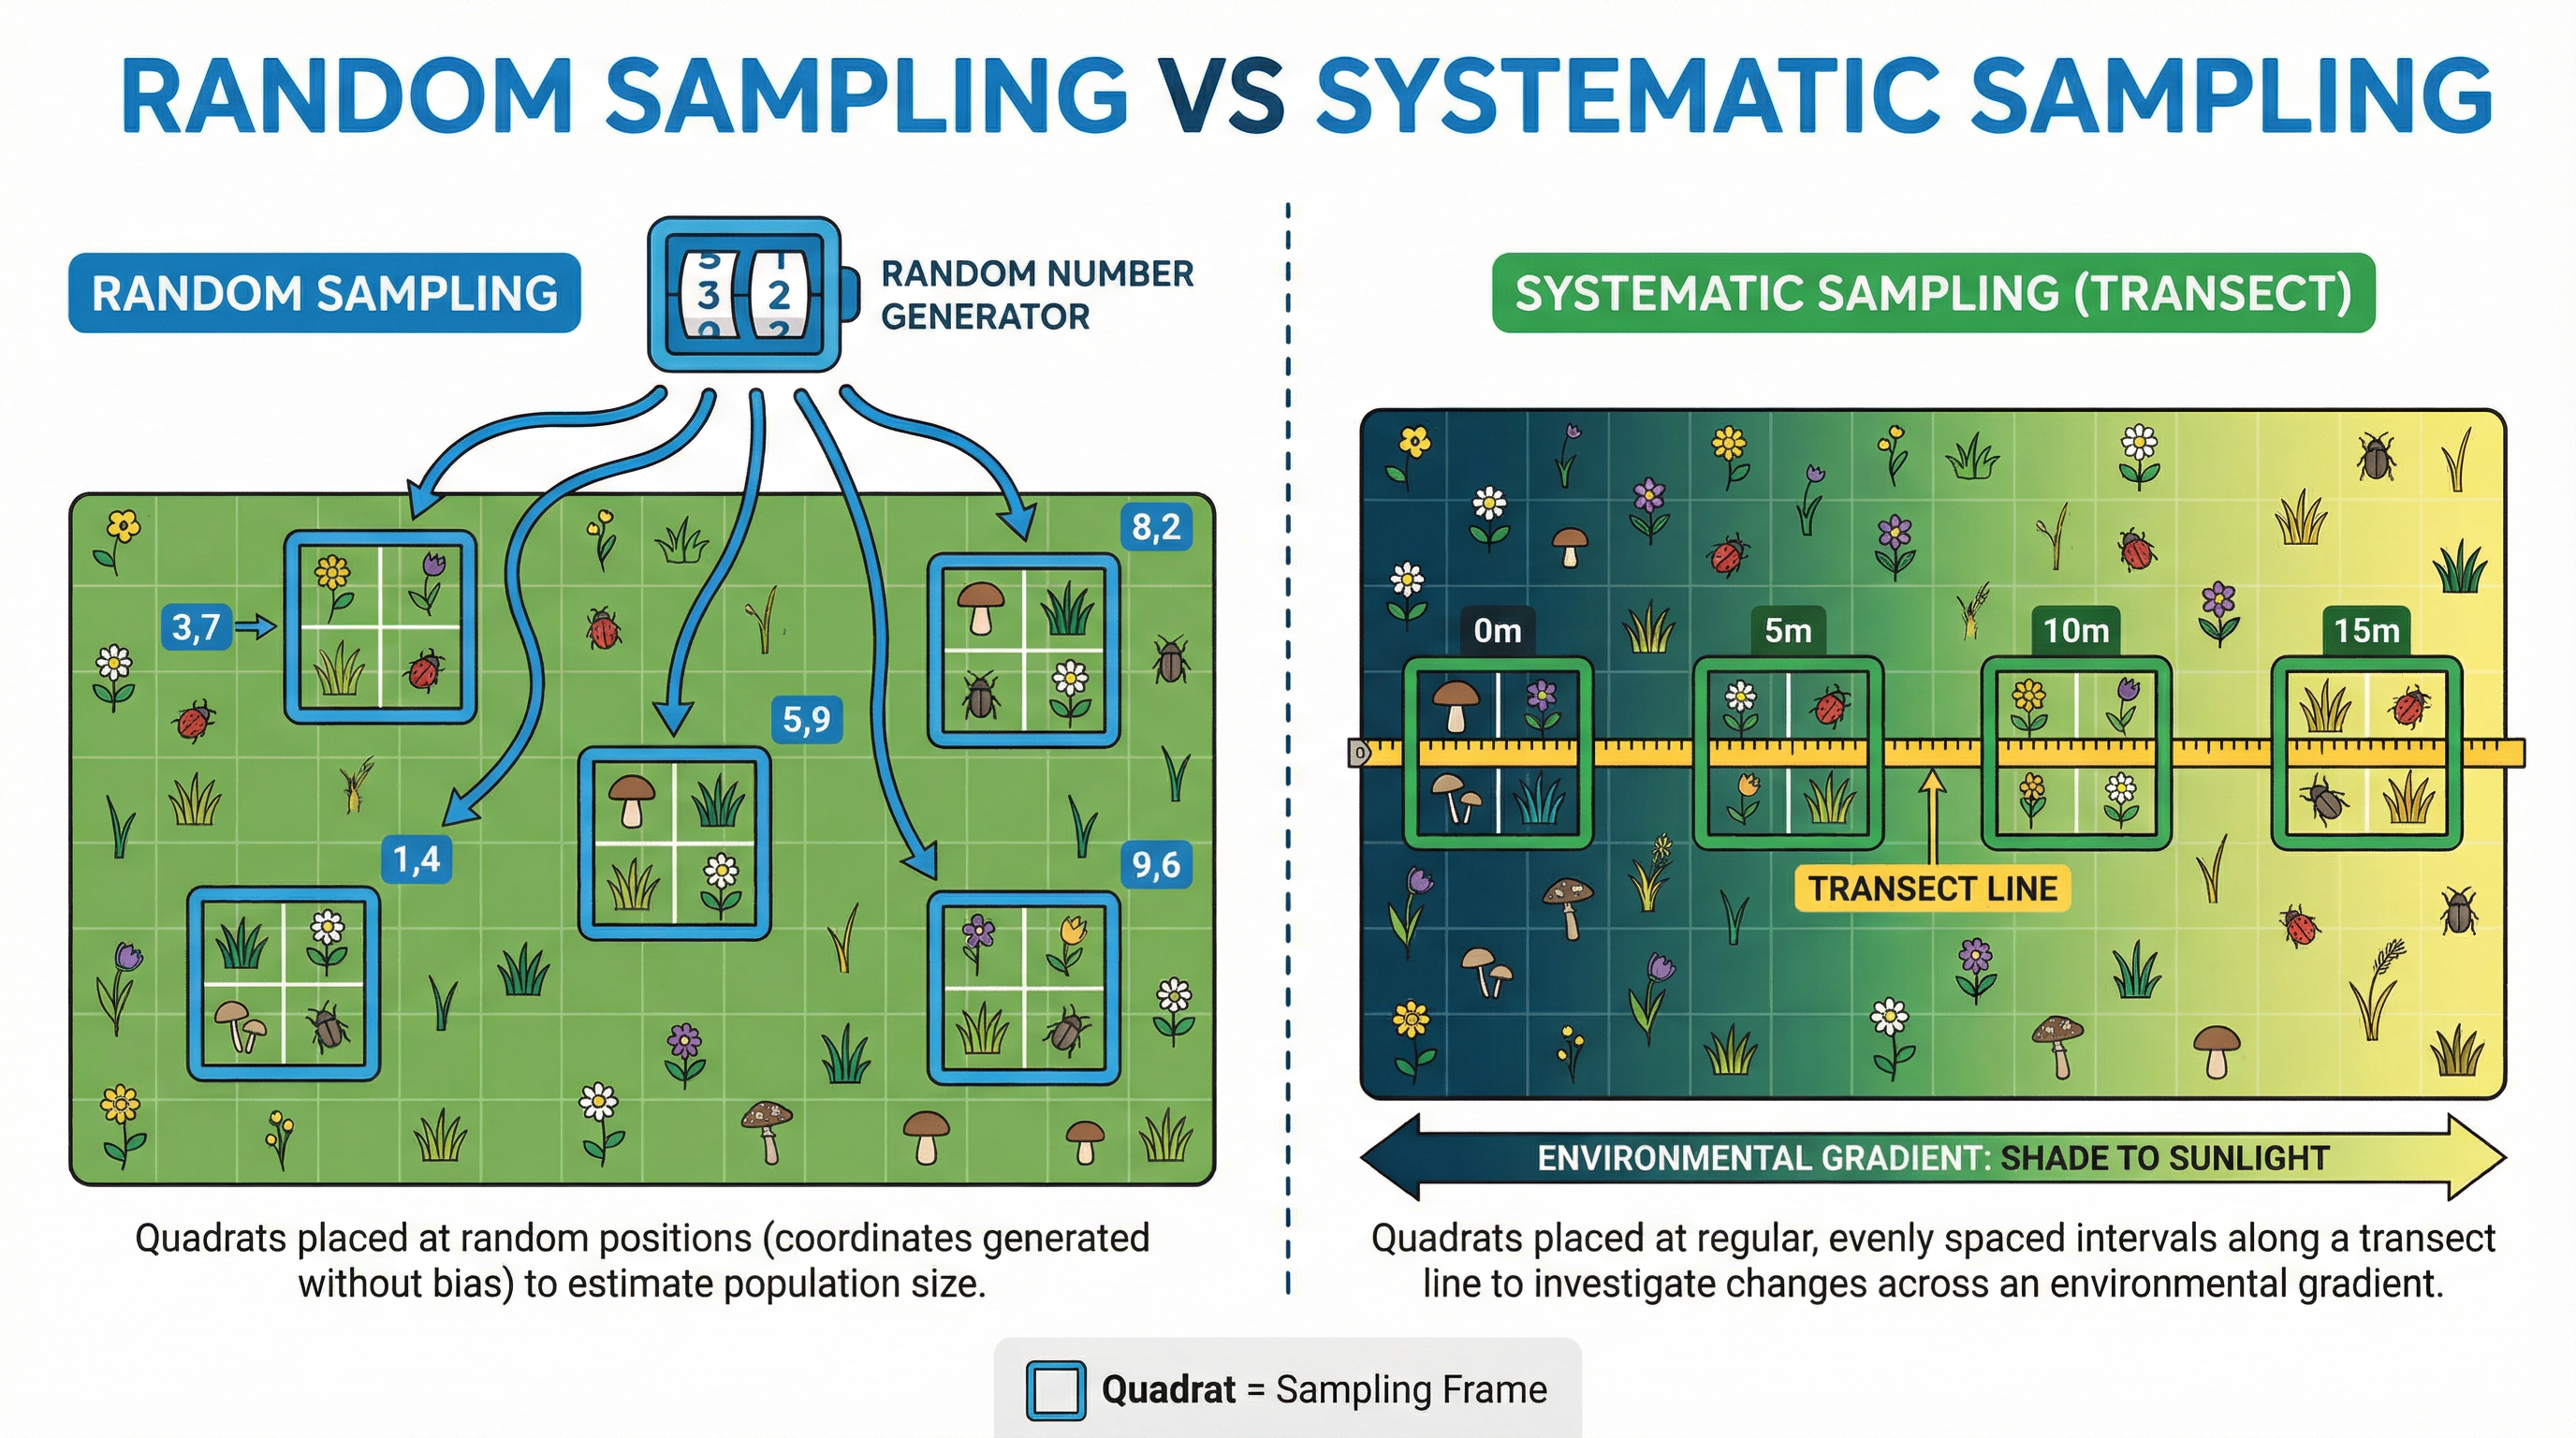
When ecologists need to know how many individuals of a particular species are in a large area, it's often impractical to count every single one. Instead, they use random sampling to get a representative estimate. The core principle is to remove human bias from the selection of sample areas.
How it Works: To ensure the sample is truly random, coordinates for where to place the sampling tool (a quadrat) are generated using a random number generator. For example, in a 10m x 10m field, you could lay two 10m tape measures along the x and y axes. A random number generator provides a pair of coordinates (e.g., 4, 8), and the quadrat is placed at that precise intersection. This process is repeated multiple times. By taking a large number of samples, the effect of any anomalous results (e.g., a quadrat landing on a patch with unusually high or low numbers) is minimised, leading to a more reliable mean.
Why it Works: Random sampling ensures that every part of the habitat has an equal chance of being sampled. This is crucial for the final estimate to be statistically valid and representative of the whole area. Examiners will not award marks for methods that introduce bias, such as throwing a quadrat over your shoulder.
Concept 2: Sampling for Distribution (Systematic Sampling)
Sometimes, the question isn't 'how many' but 'where'. Ecologists use systematic sampling to investigate how the distribution of a species changes across an environmental gradient. This involves sampling at regular, fixed intervals.
How it Works: The most common method is a line transect. A tape measure is laid out across the area of interest, for example, from a shaded area under a tree out into an open field. A quadrat is then placed at regular intervals along this line (e.g., every 2 metres), and the organisms within it are counted. This allows for a direct comparison between the changing abiotic factor (like light intensity) and the abundance of the species.
Why it Works: By sampling systematically, you can correlate the presence or absence of a species with specific environmental factors. This helps to explain why a species is found in a particular part of a habitat. For example, you might find that a certain plant species is abundant in the high-light conditions of the open field but absent in the shade, allowing you to form a conclusion about its light requirements.
Mathematical/Scientific Relationships
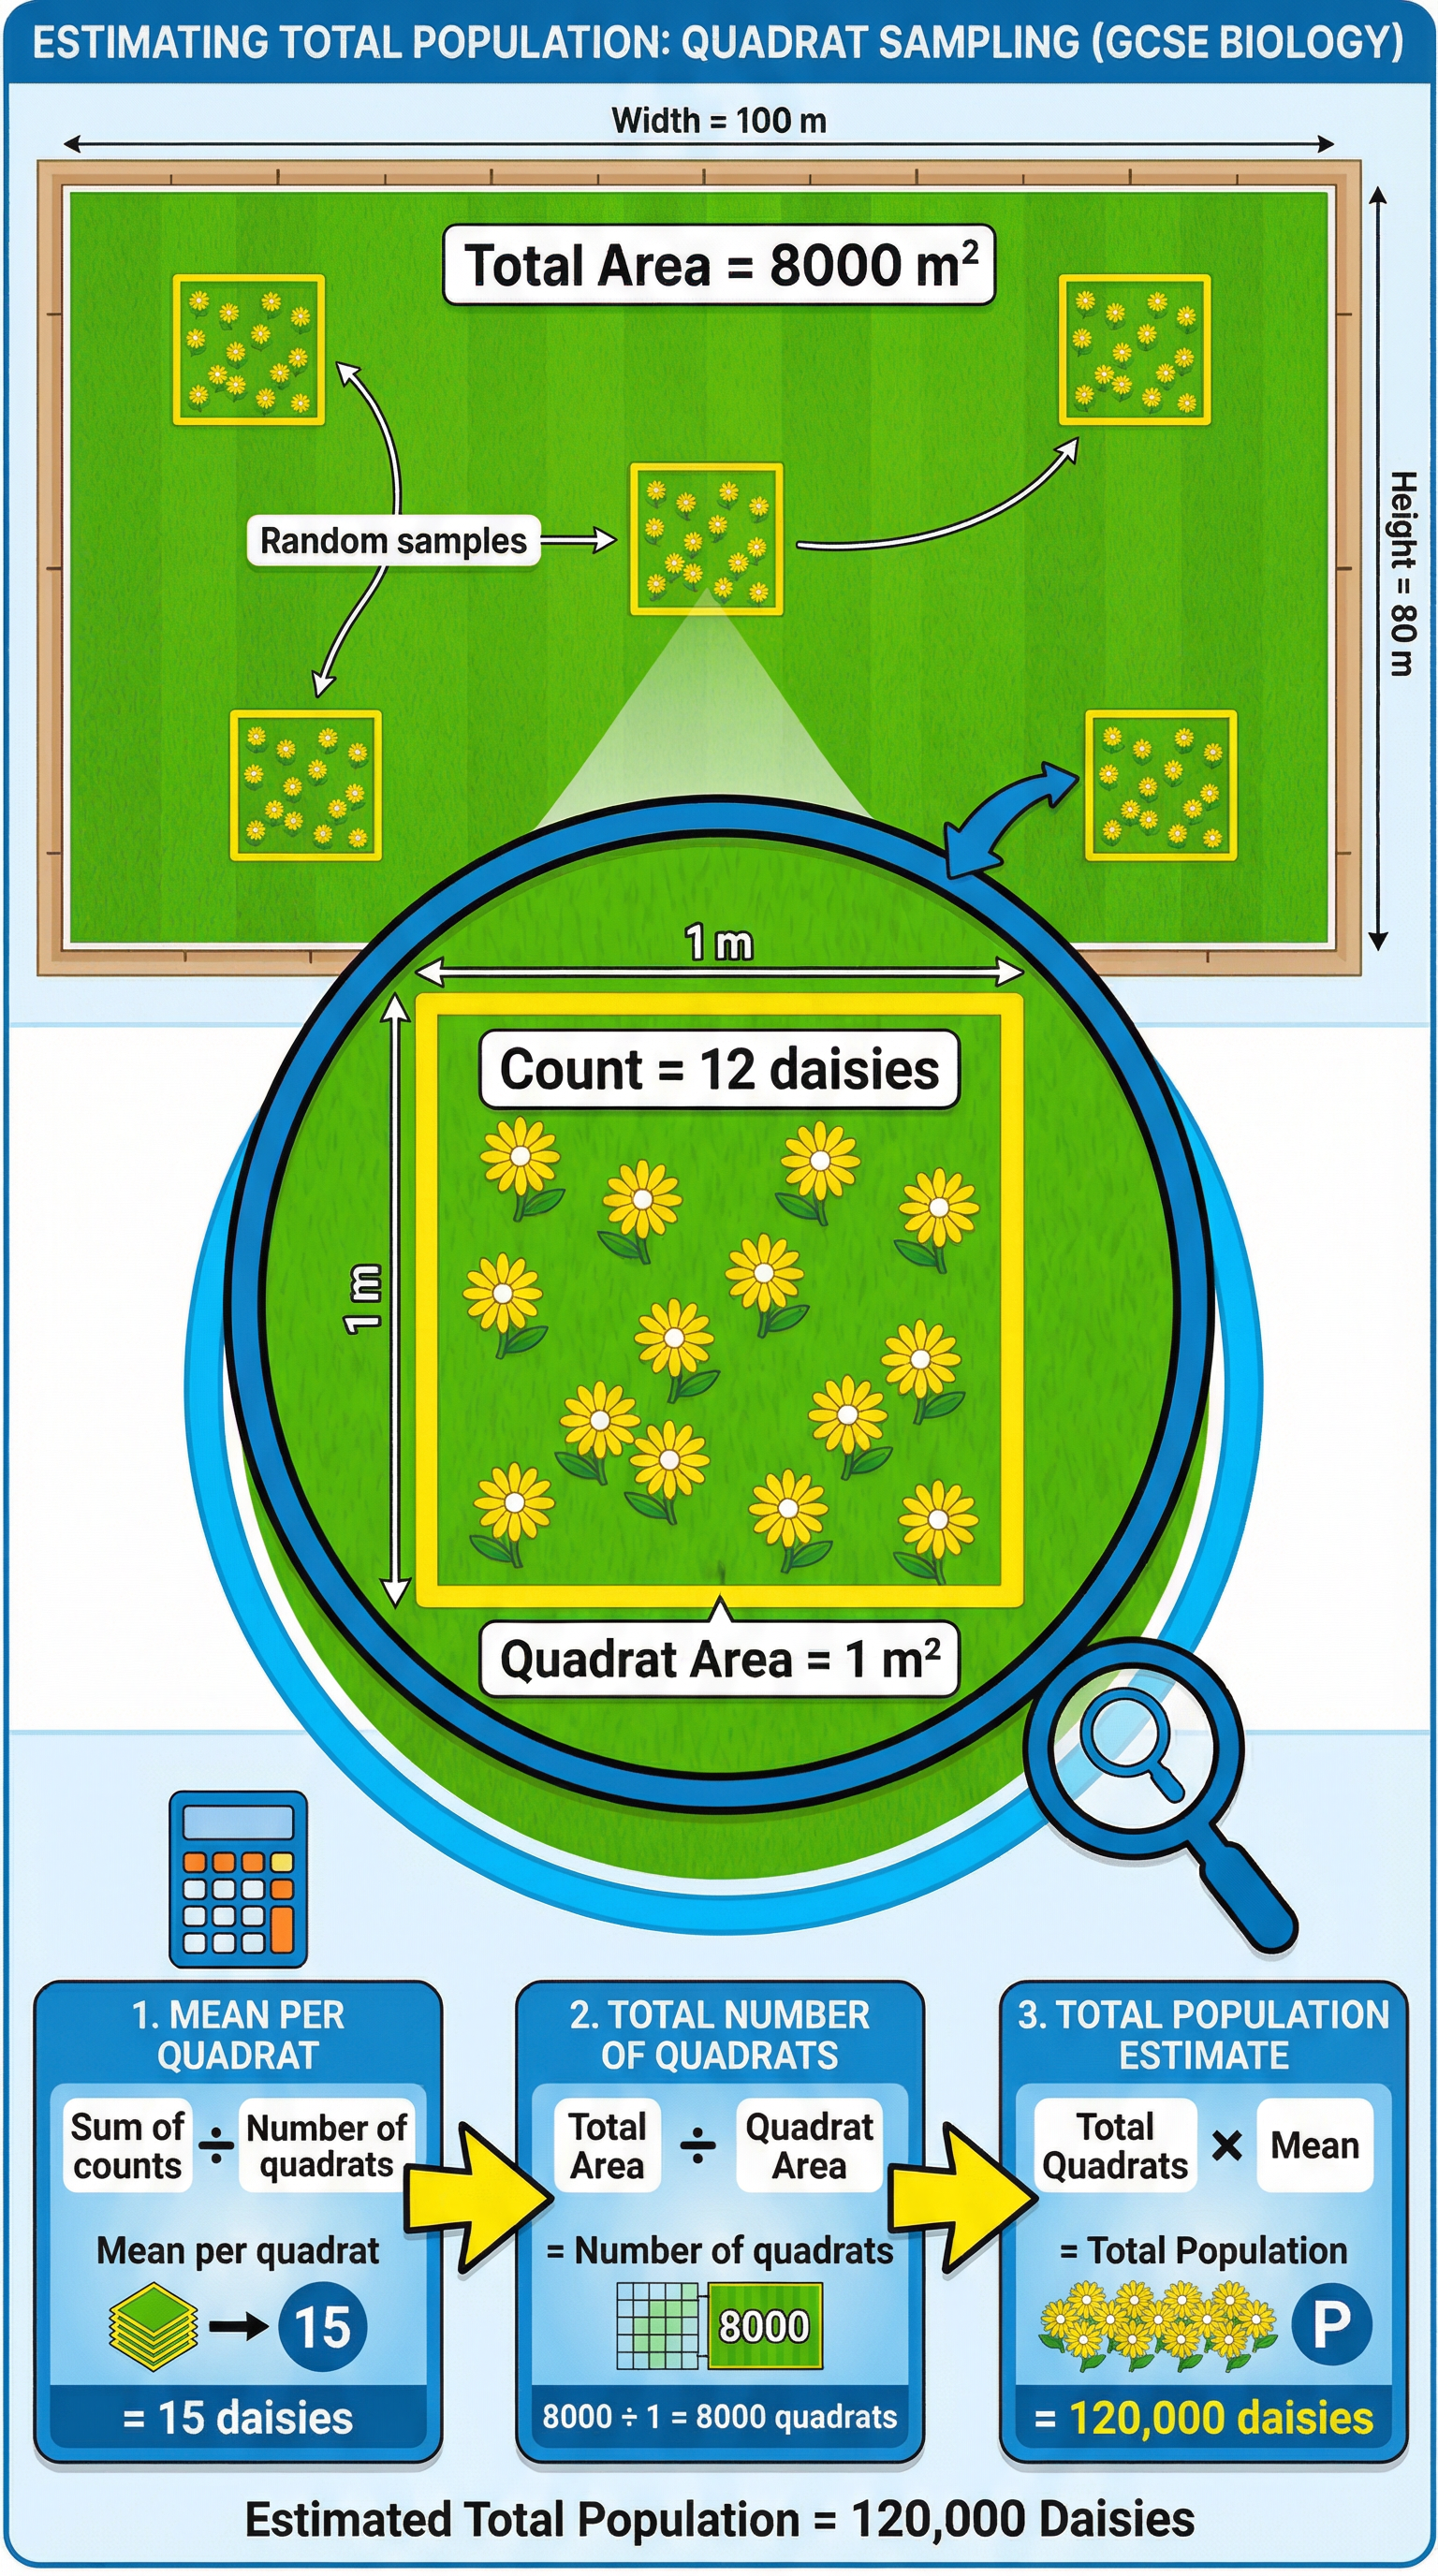
Estimating Total Population Size (Must Memorise)
This is a crucial calculation that frequently appears on exam papers. You must show your working to gain full credit.
Formula:
Total Population = (Total Area / Sample Area) x Mean number of organisms per sample
Symbol Meanings:
- Total Area: The entire area of the habitat being studied (e.g., the area of the field in m²).
- Sample Area: The area of a single quadrat (e.g., 1m x 1m = 1m²).
- Mean number of organisms per sample: The average number of individuals counted across all your quadrats. You calculate this by summing the counts from all quadrats and dividing by the number of quadrats you used.
Practical Applications
This topic directly relates to the AQA Required Practical Activity 10: investigate the effect of a factor on the distribution of a chosen species. In this practical, you would typically use a line transect to investigate how an abiotic factor like light intensity, soil pH, or moisture affects the distribution of a plant species like daisies or dandelions on a school field. You would be expected to handle the equipment correctly, record data in a suitable table, plot a graph of your results (e.g., number of daisies vs. distance along transect), and draw a valid conclusion. Examiners can ask you to describe this method, analyse sample data from it, or evaluate its design.