Study Notes
Overview
Welcome to the study of Ecosystems, a cornerstone of your OCR GCSE Biology specification. This topic explores the intricate web of life, examining how living organisms (biotic factors) interact with each other and their non-living (abiotic) environment. Mastering this topic is crucial as it integrates concepts from across the biology curriculum, from cell biology to genetics, and is frequently tested through data analysis and long-answer questions. Examiners are looking for candidates who can move beyond simple definitions and explain the dynamic processes that sustain life, such as energy transfer and nutrient cycling. Expect to be challenged on your practical knowledge of fieldwork techniques (PAG 3) and your ability to interpret graphical data representing population changes over time.
Key Concepts
Levels of Organisation
To understand ecosystems, we must first define how they are structured. This hierarchy is a favourite for AO1 questions.
- Population: A group of organisms of the same species living in a habitat. For example, all the squirrels in a woodland.
- Community: All the populations of different species living and interacting in a habitat. For example, the squirrels, oak trees, blackbirds, and fungi in the woodland.
- Ecosystem: The interaction between the community of living organisms and the non-living (abiotic) parts of their environment. The woodland community plus the soil, rainfall, and temperature make up the ecosystem.
Energy Transfer and Trophic Levels
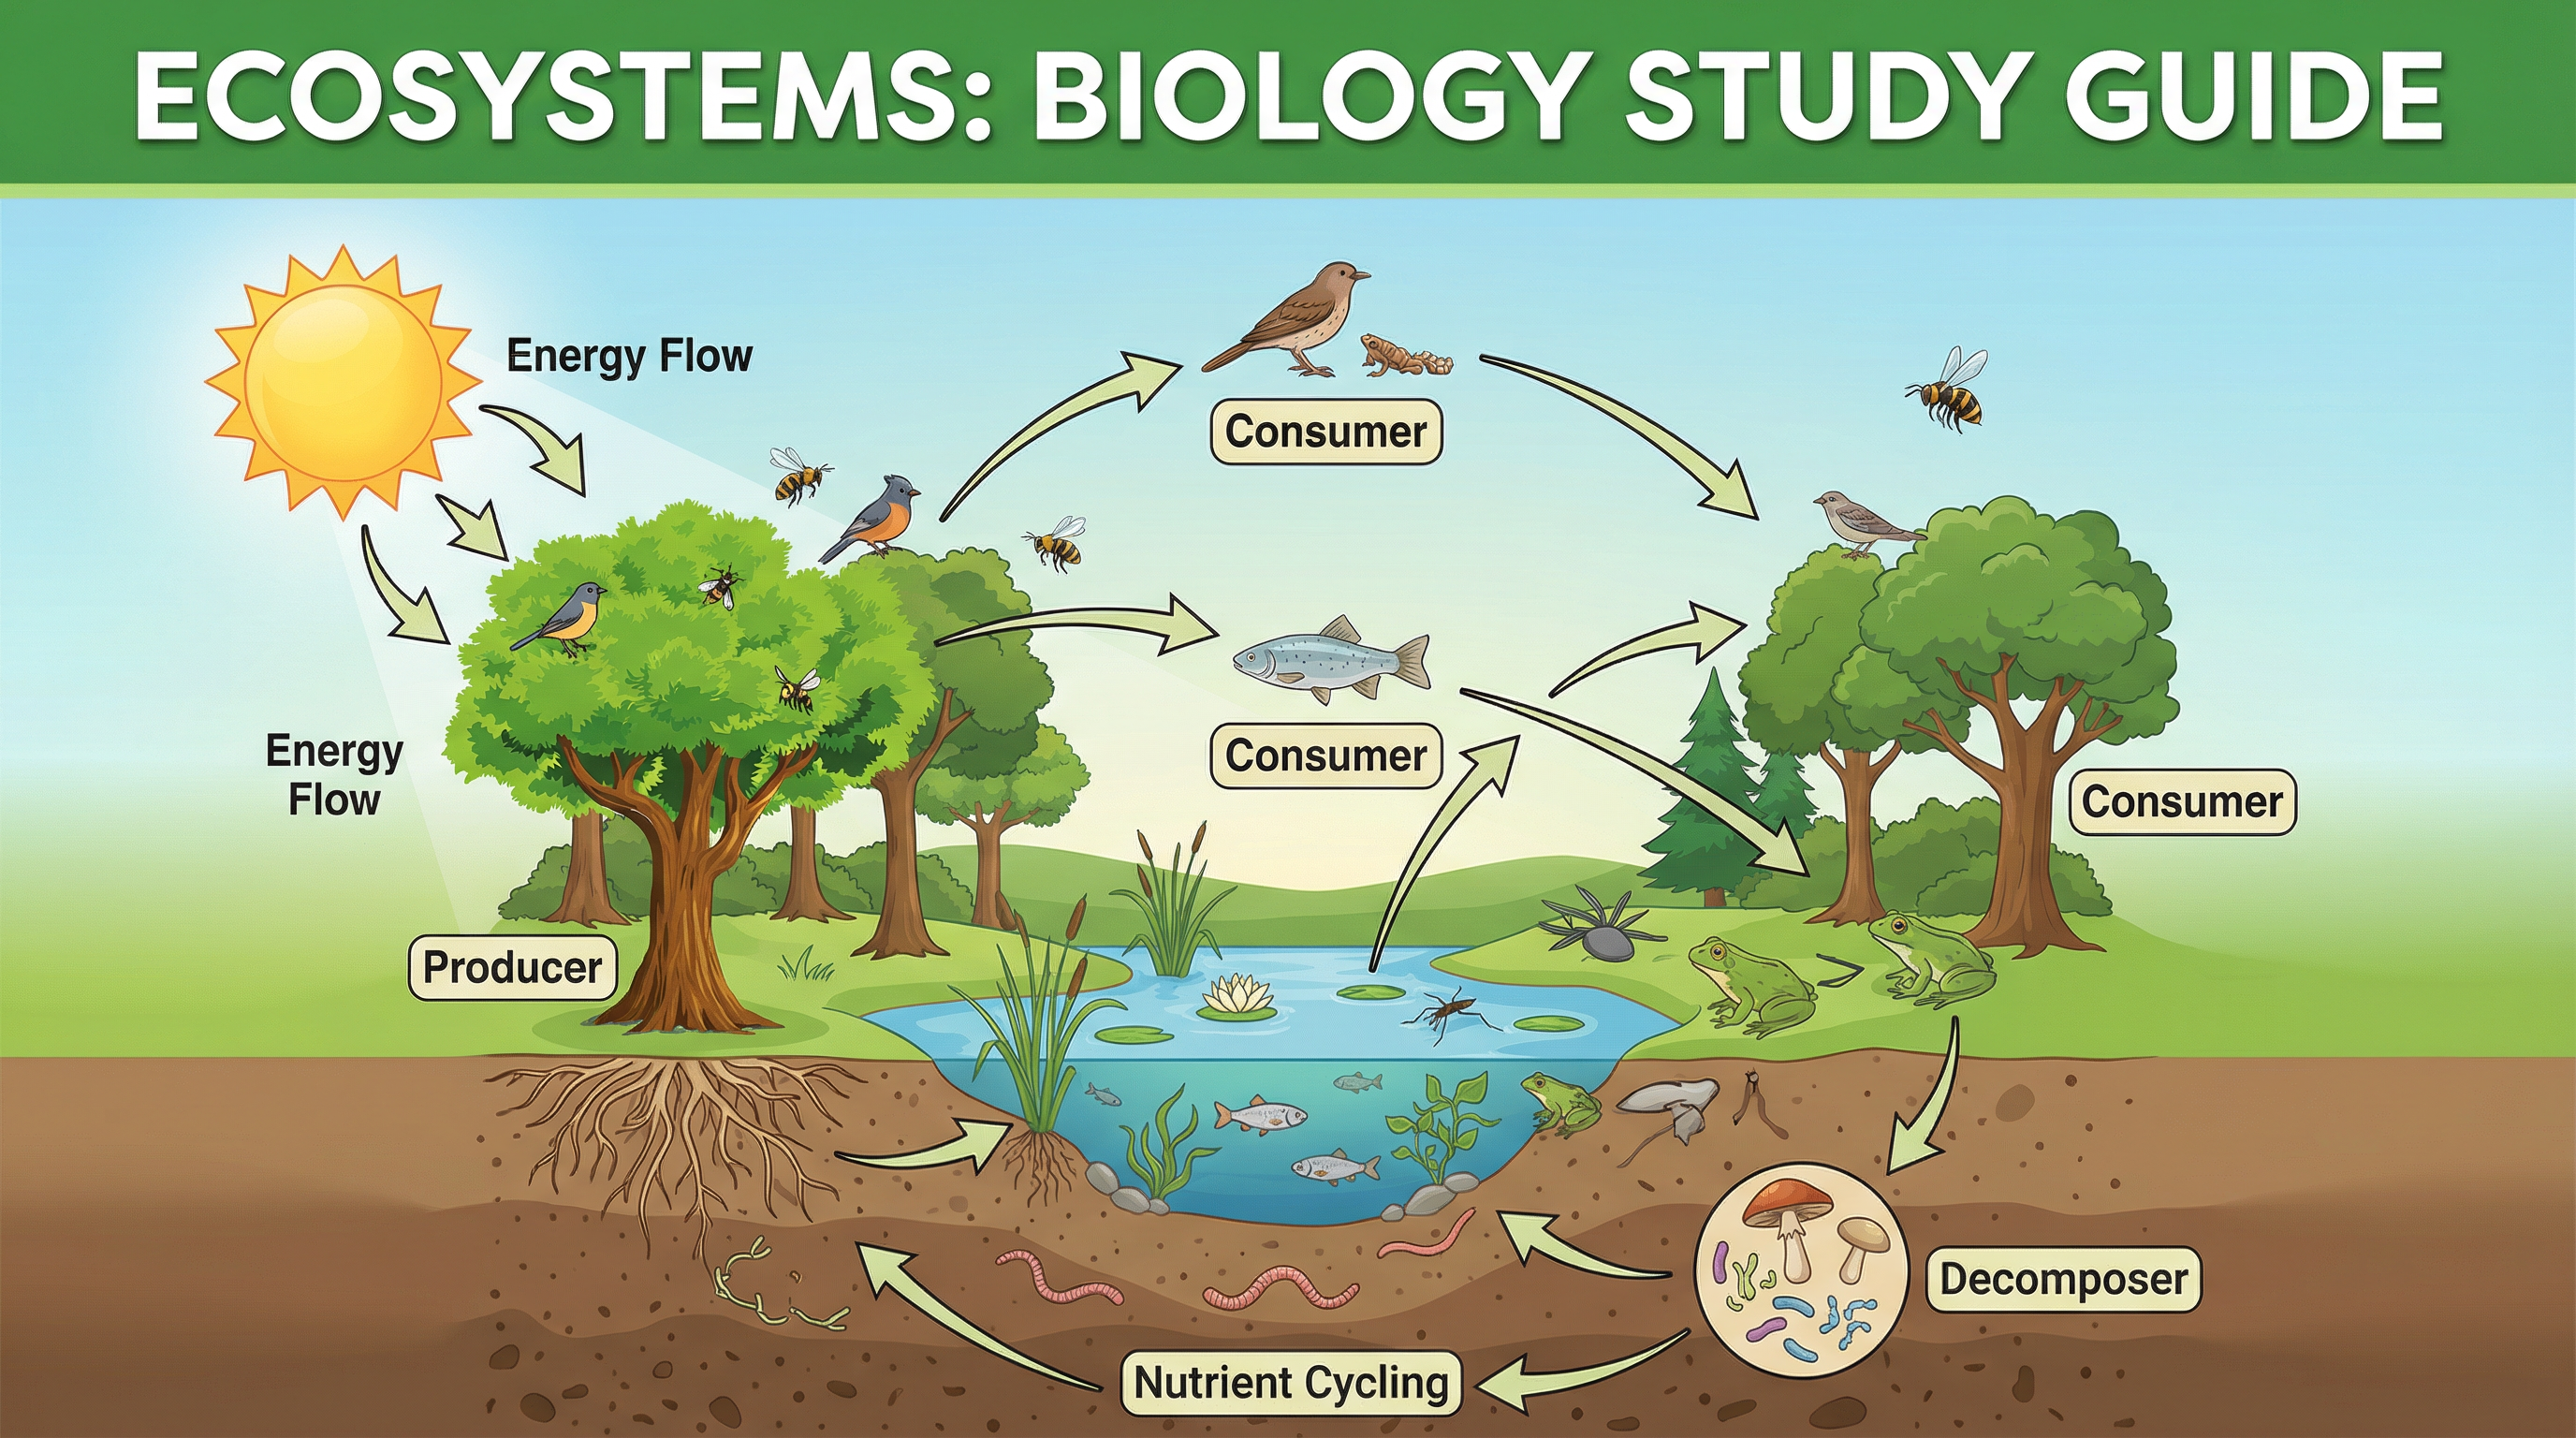
Energy flows through an ecosystem, and its path is represented by food chains and food webs. The sun is the ultimate source of energy for most life on Earth.
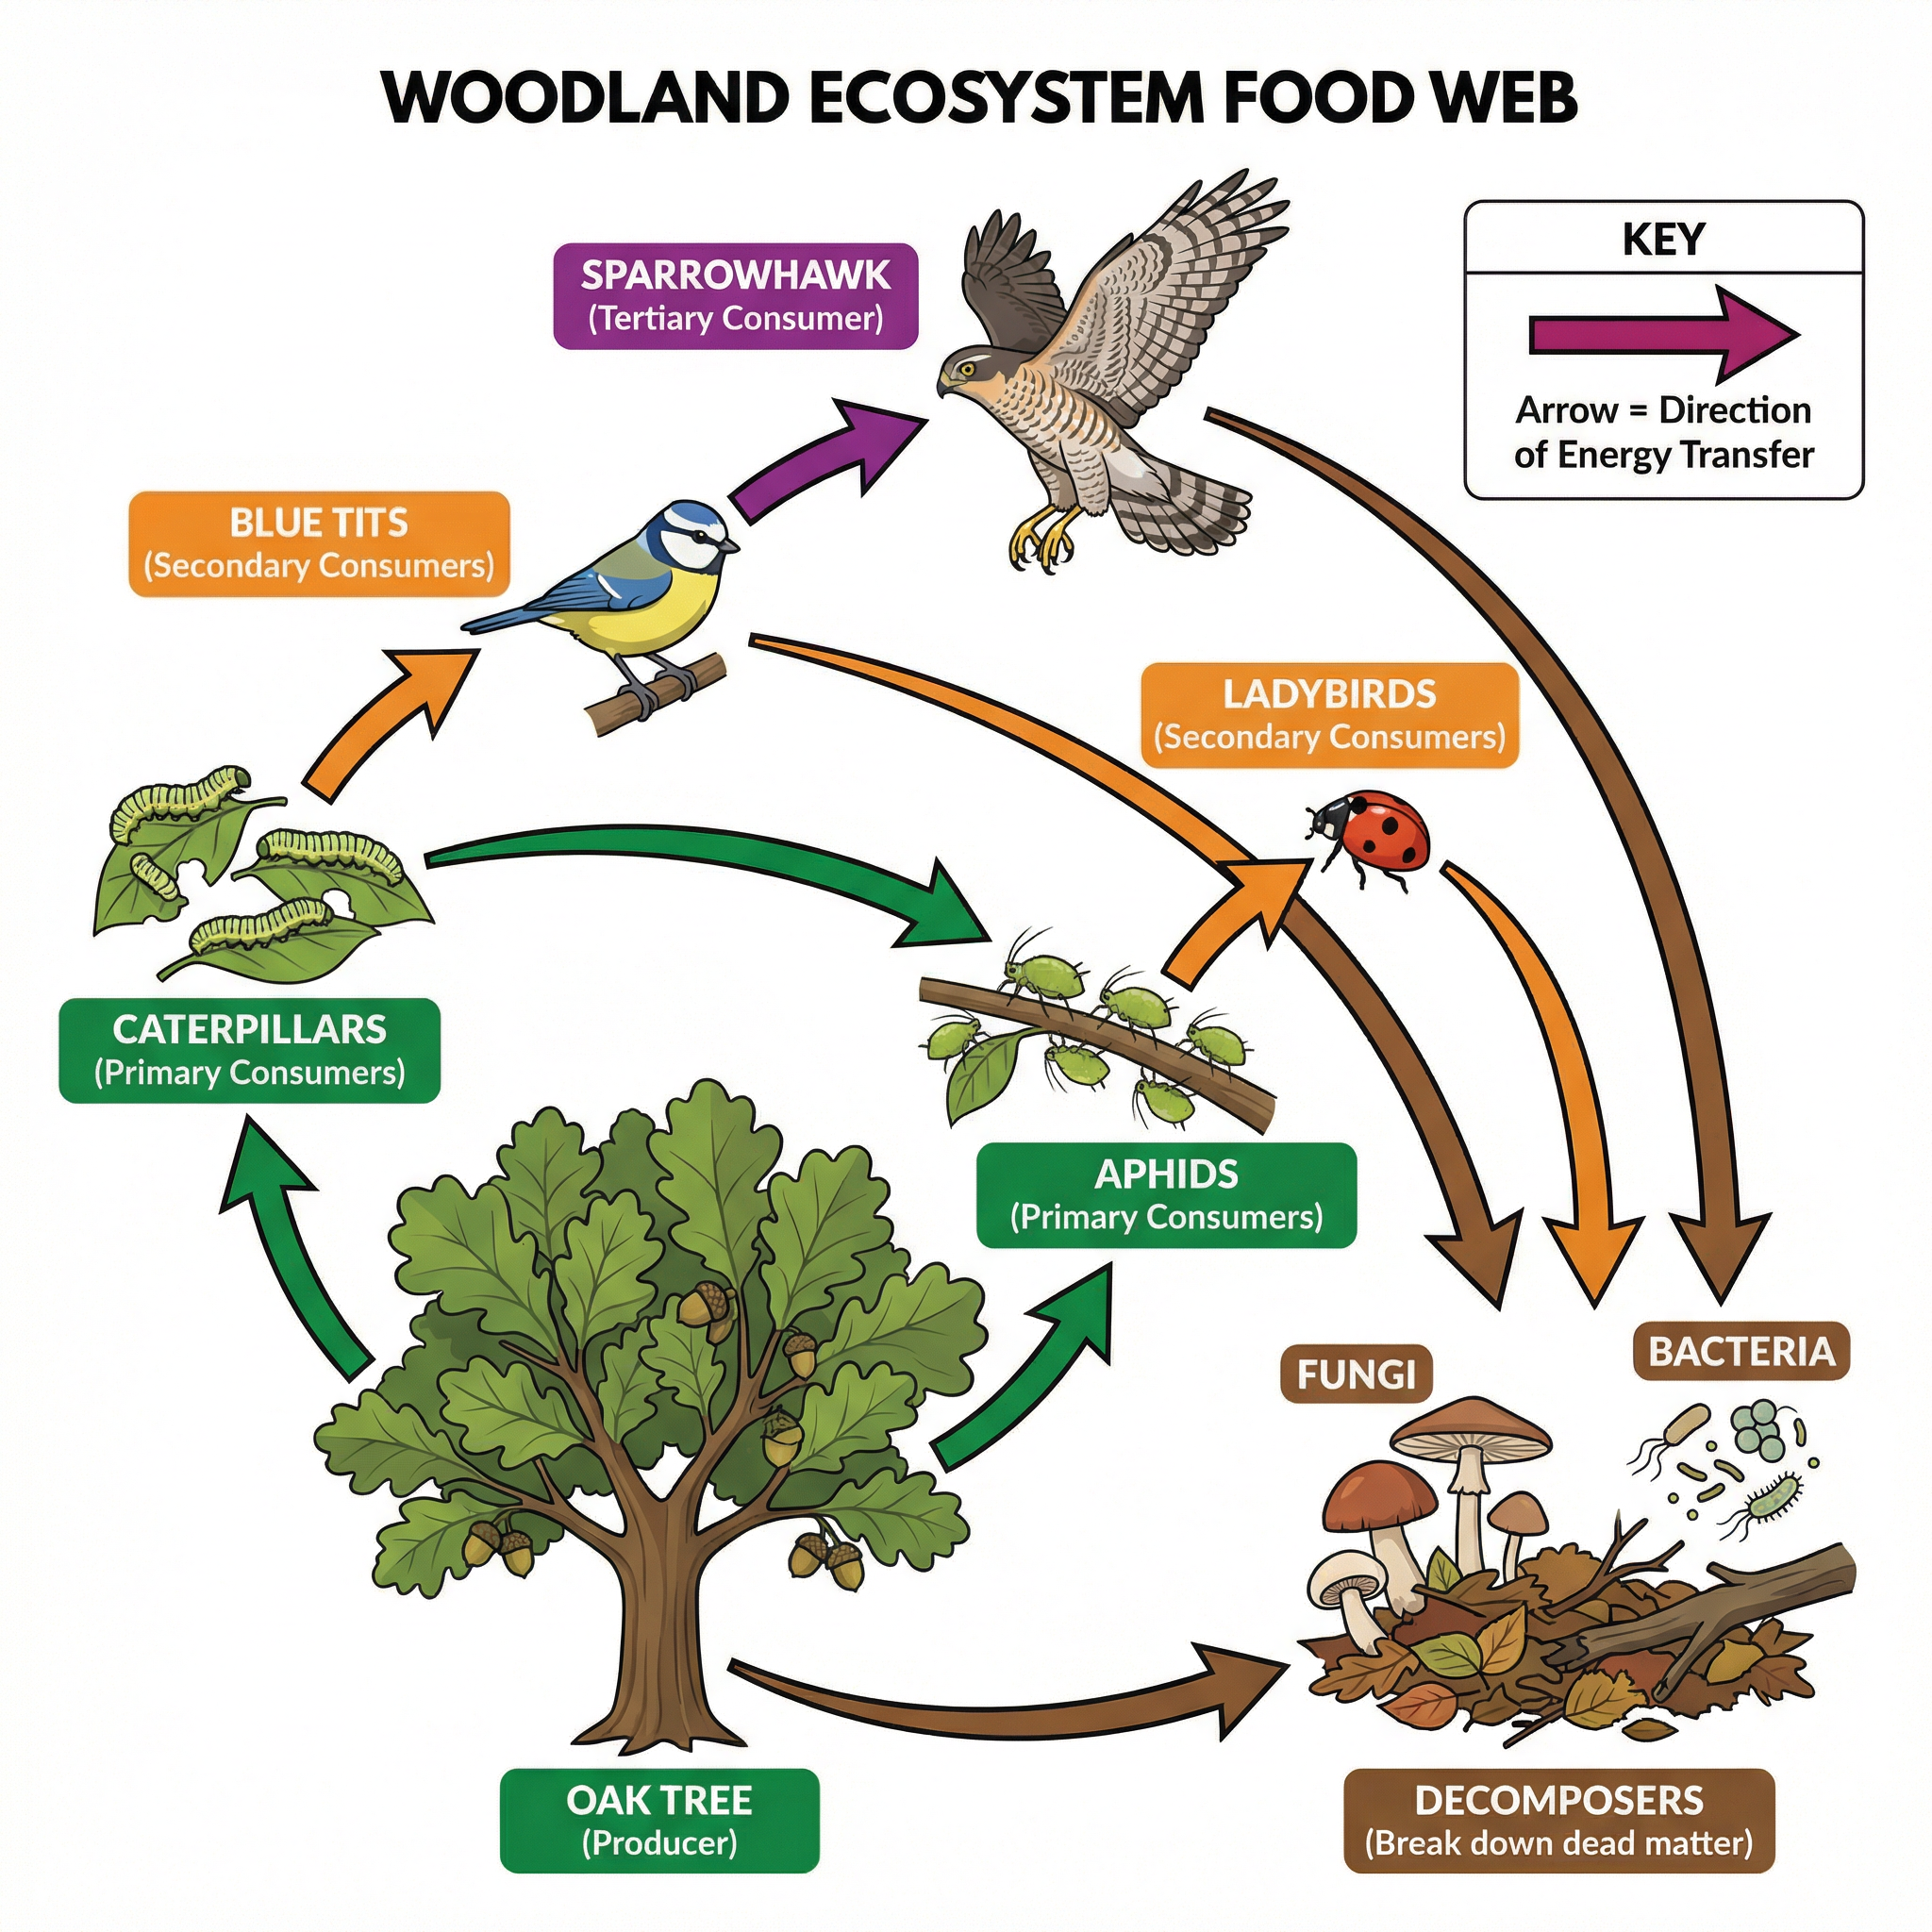
- Producers: Organisms, primarily green plants and algae, that create their own food. They convert light energy into chemical energy (glucose) via photosynthesis. They are at the first trophic level.
- Consumers: Organisms that obtain energy by feeding on other organisms.
- Primary Consumers: Herbivores that eat producers (Trophic Level 2).
- Secondary Consumers: Carnivores or omnivores that eat primary consumers (Trophic Level 3).
- Tertiary Consumers: Carnivores or omnivores that eat secondary consumers (Trophic Level 4).
- Decomposers: Organisms like bacteria and fungi that break down dead organic matter and waste products. They do this via extracellular digestion, releasing enzymes to break down the material and then absorbing the nutrients. This process is vital for recycling mineral ions back into the soil.
Crucially, energy transfer between trophic levels is inefficient. Only about 10% of the energy from one level is incorporated into the biomass of the next. The remaining 90% is lost, primarily through:
- Respiration: Energy is released as heat.
- Movement: Organisms use energy to move.
- Incomplete Consumption: Not all parts of an organism are eaten.
- Egestion/Excretion: Waste products contain energy.
This inefficiency limits the length of food chains and explains why the biomass at each successive trophic level decreases.
Nutrient Cycling: The Carbon Cycle
While energy flows through an ecosystem, nutrients are recycled. The carbon cycle is a key example that you must be able to explain in detail for a potential 6-mark question.
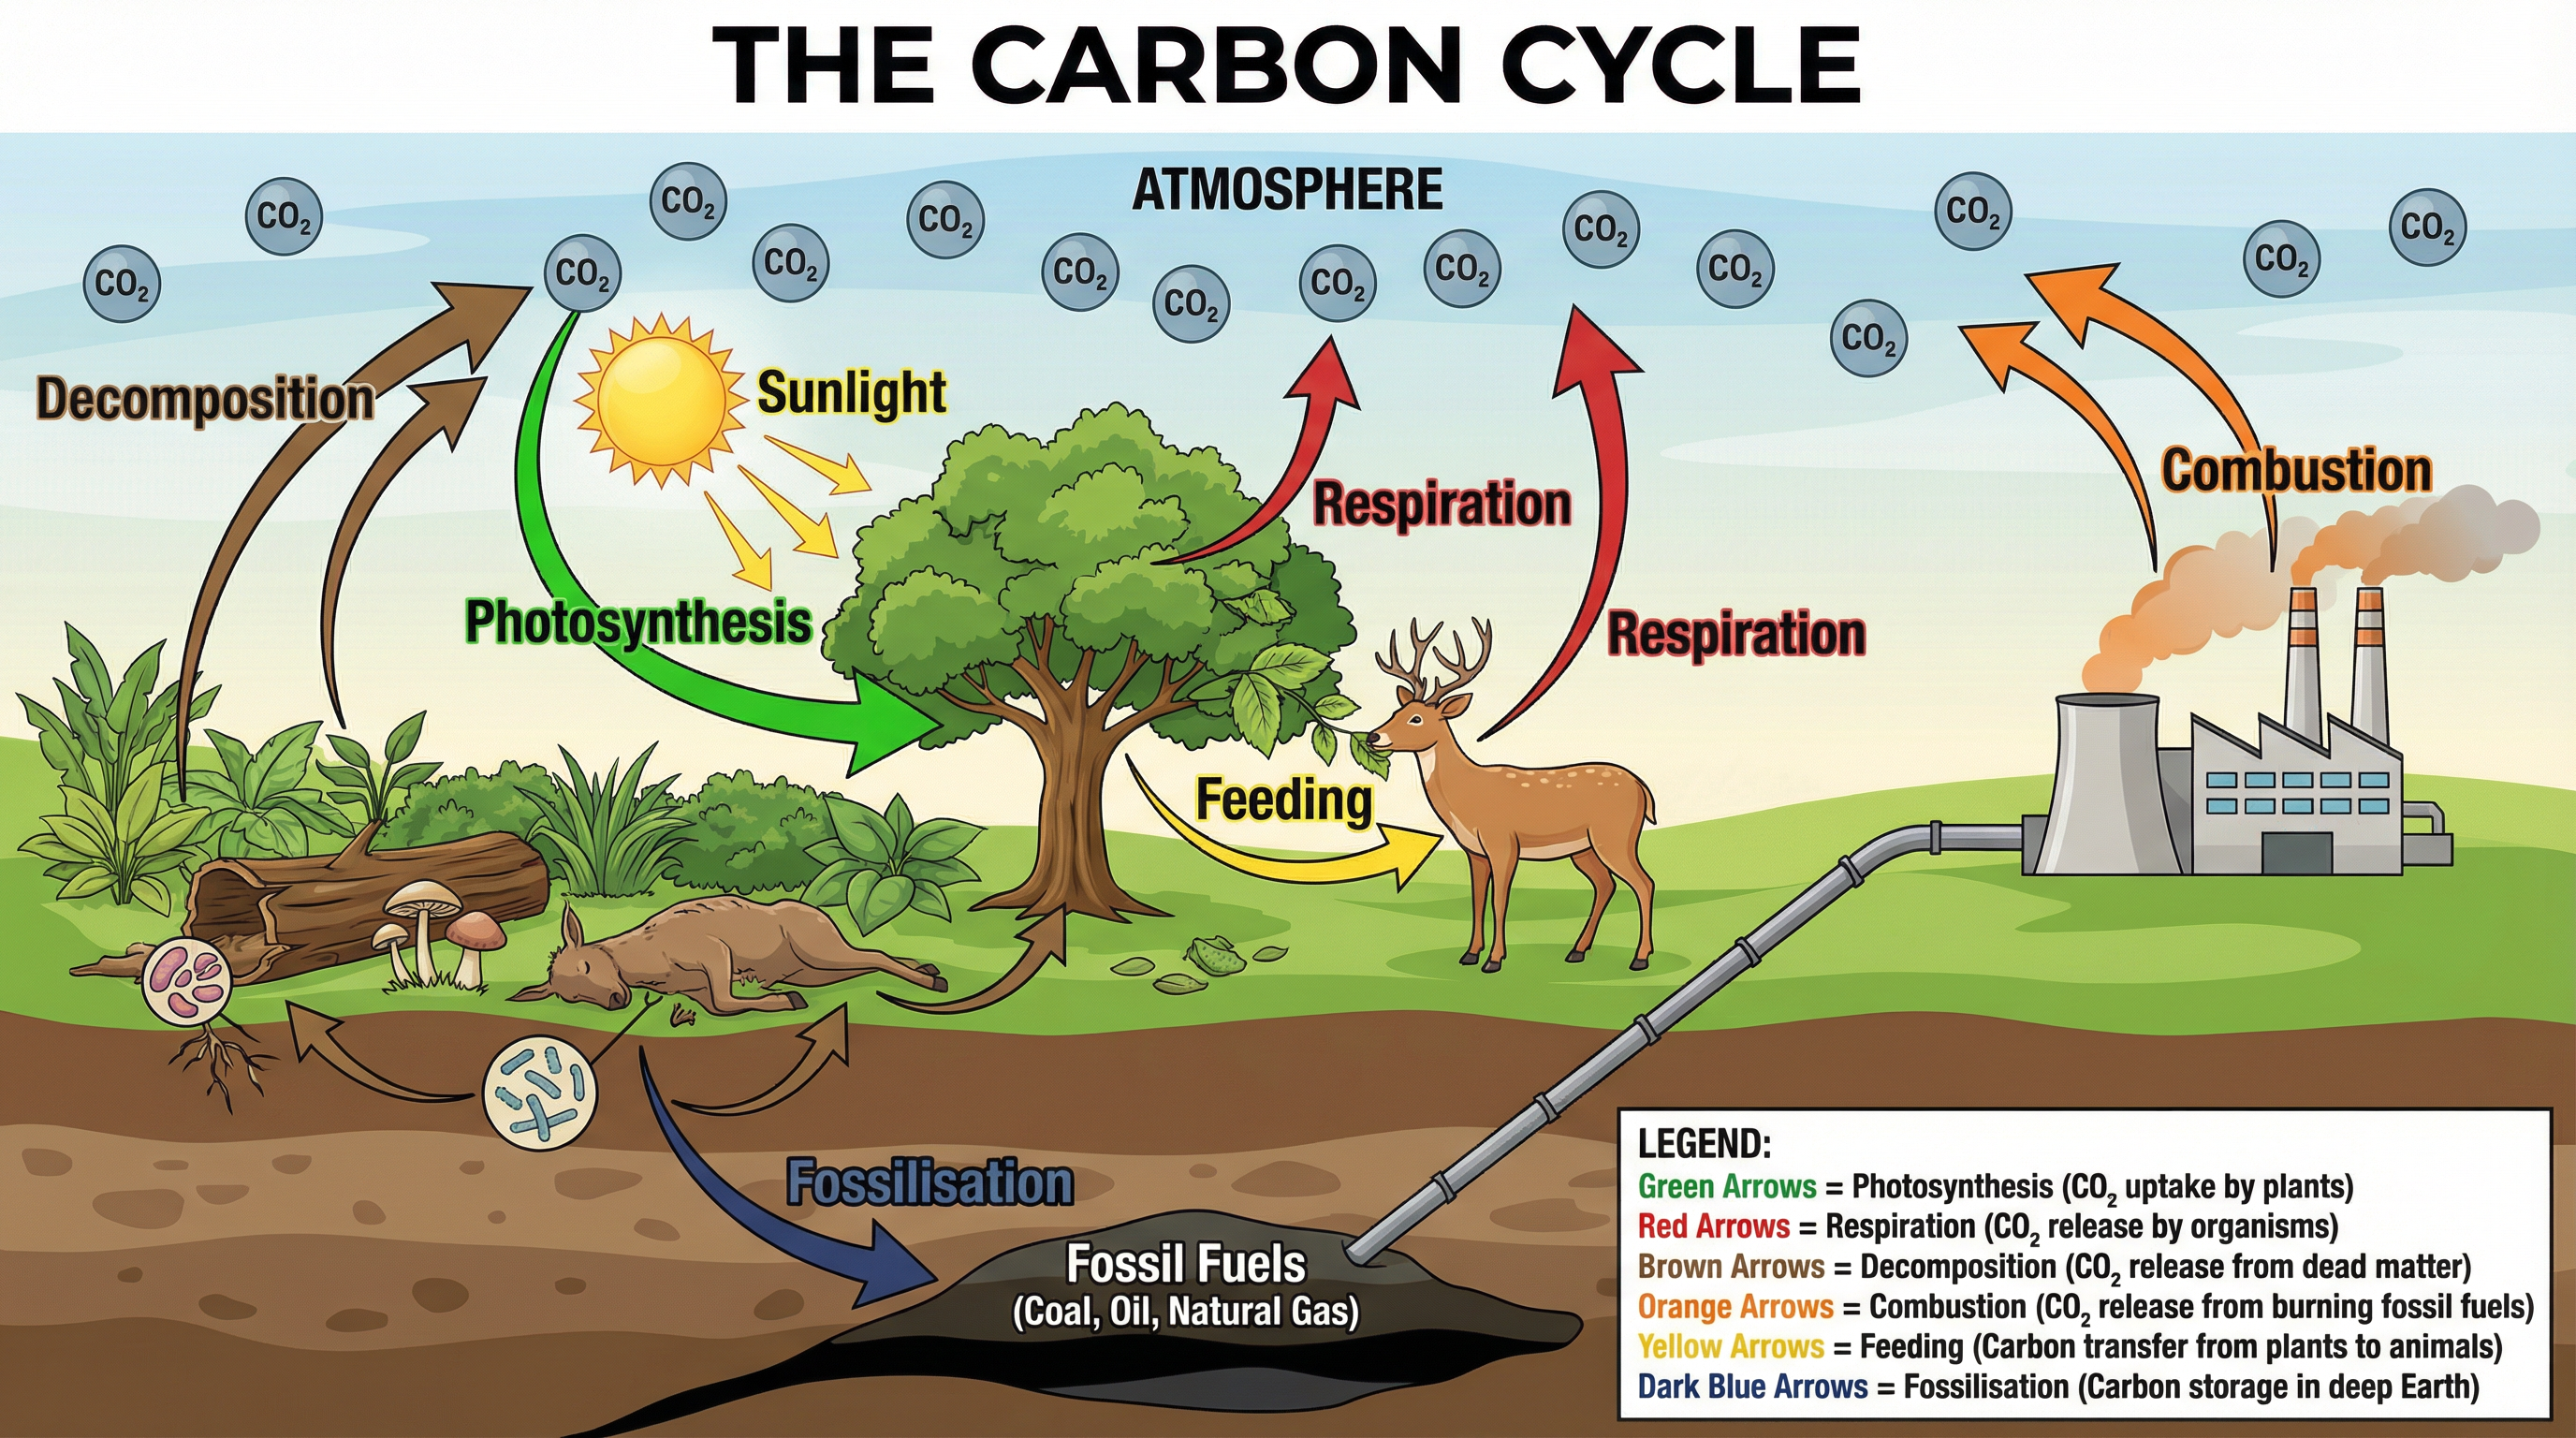
Key processes move carbon between the atmosphere, oceans, and living organisms:
- Photosynthesis: Plants remove CO2 from the atmosphere.
- Respiration: Plants, animals, and decomposers release CO2 into the atmosphere.
- Feeding: Carbon compounds are passed along the food chain.
- Decomposition: Decomposers break down dead organisms, returning carbon to the soil and CO2 to the atmosphere through respiration.
- Combustion: Burning fossil fuels (which are the fossilised remains of ancient organisms) releases large amounts of CO2 into the atmosphere.
Interdependence and Abiotic/Biotic Factors
Organisms are dependent on each other (e.g., for food, pollination) and their environment. The distribution and abundance of species are affected by:
- Biotic Factors: Living factors such as competition for resources, predators, and disease.
- Abiotic Factors: Non-living factors such as light intensity, temperature, moisture levels, and soil pH.
Mathematical/Scientific Relationships
Population Size Estimation (Quadrat Sampling)
This is a required practical skill (PAG 3) and a common source of calculation questions.
Formula: Must memorise
Population Size = (Total survey area / Area sampled) × Number of organisms counted
Example:
- A field is 100m x 50m (Total Area = 5000 m²).
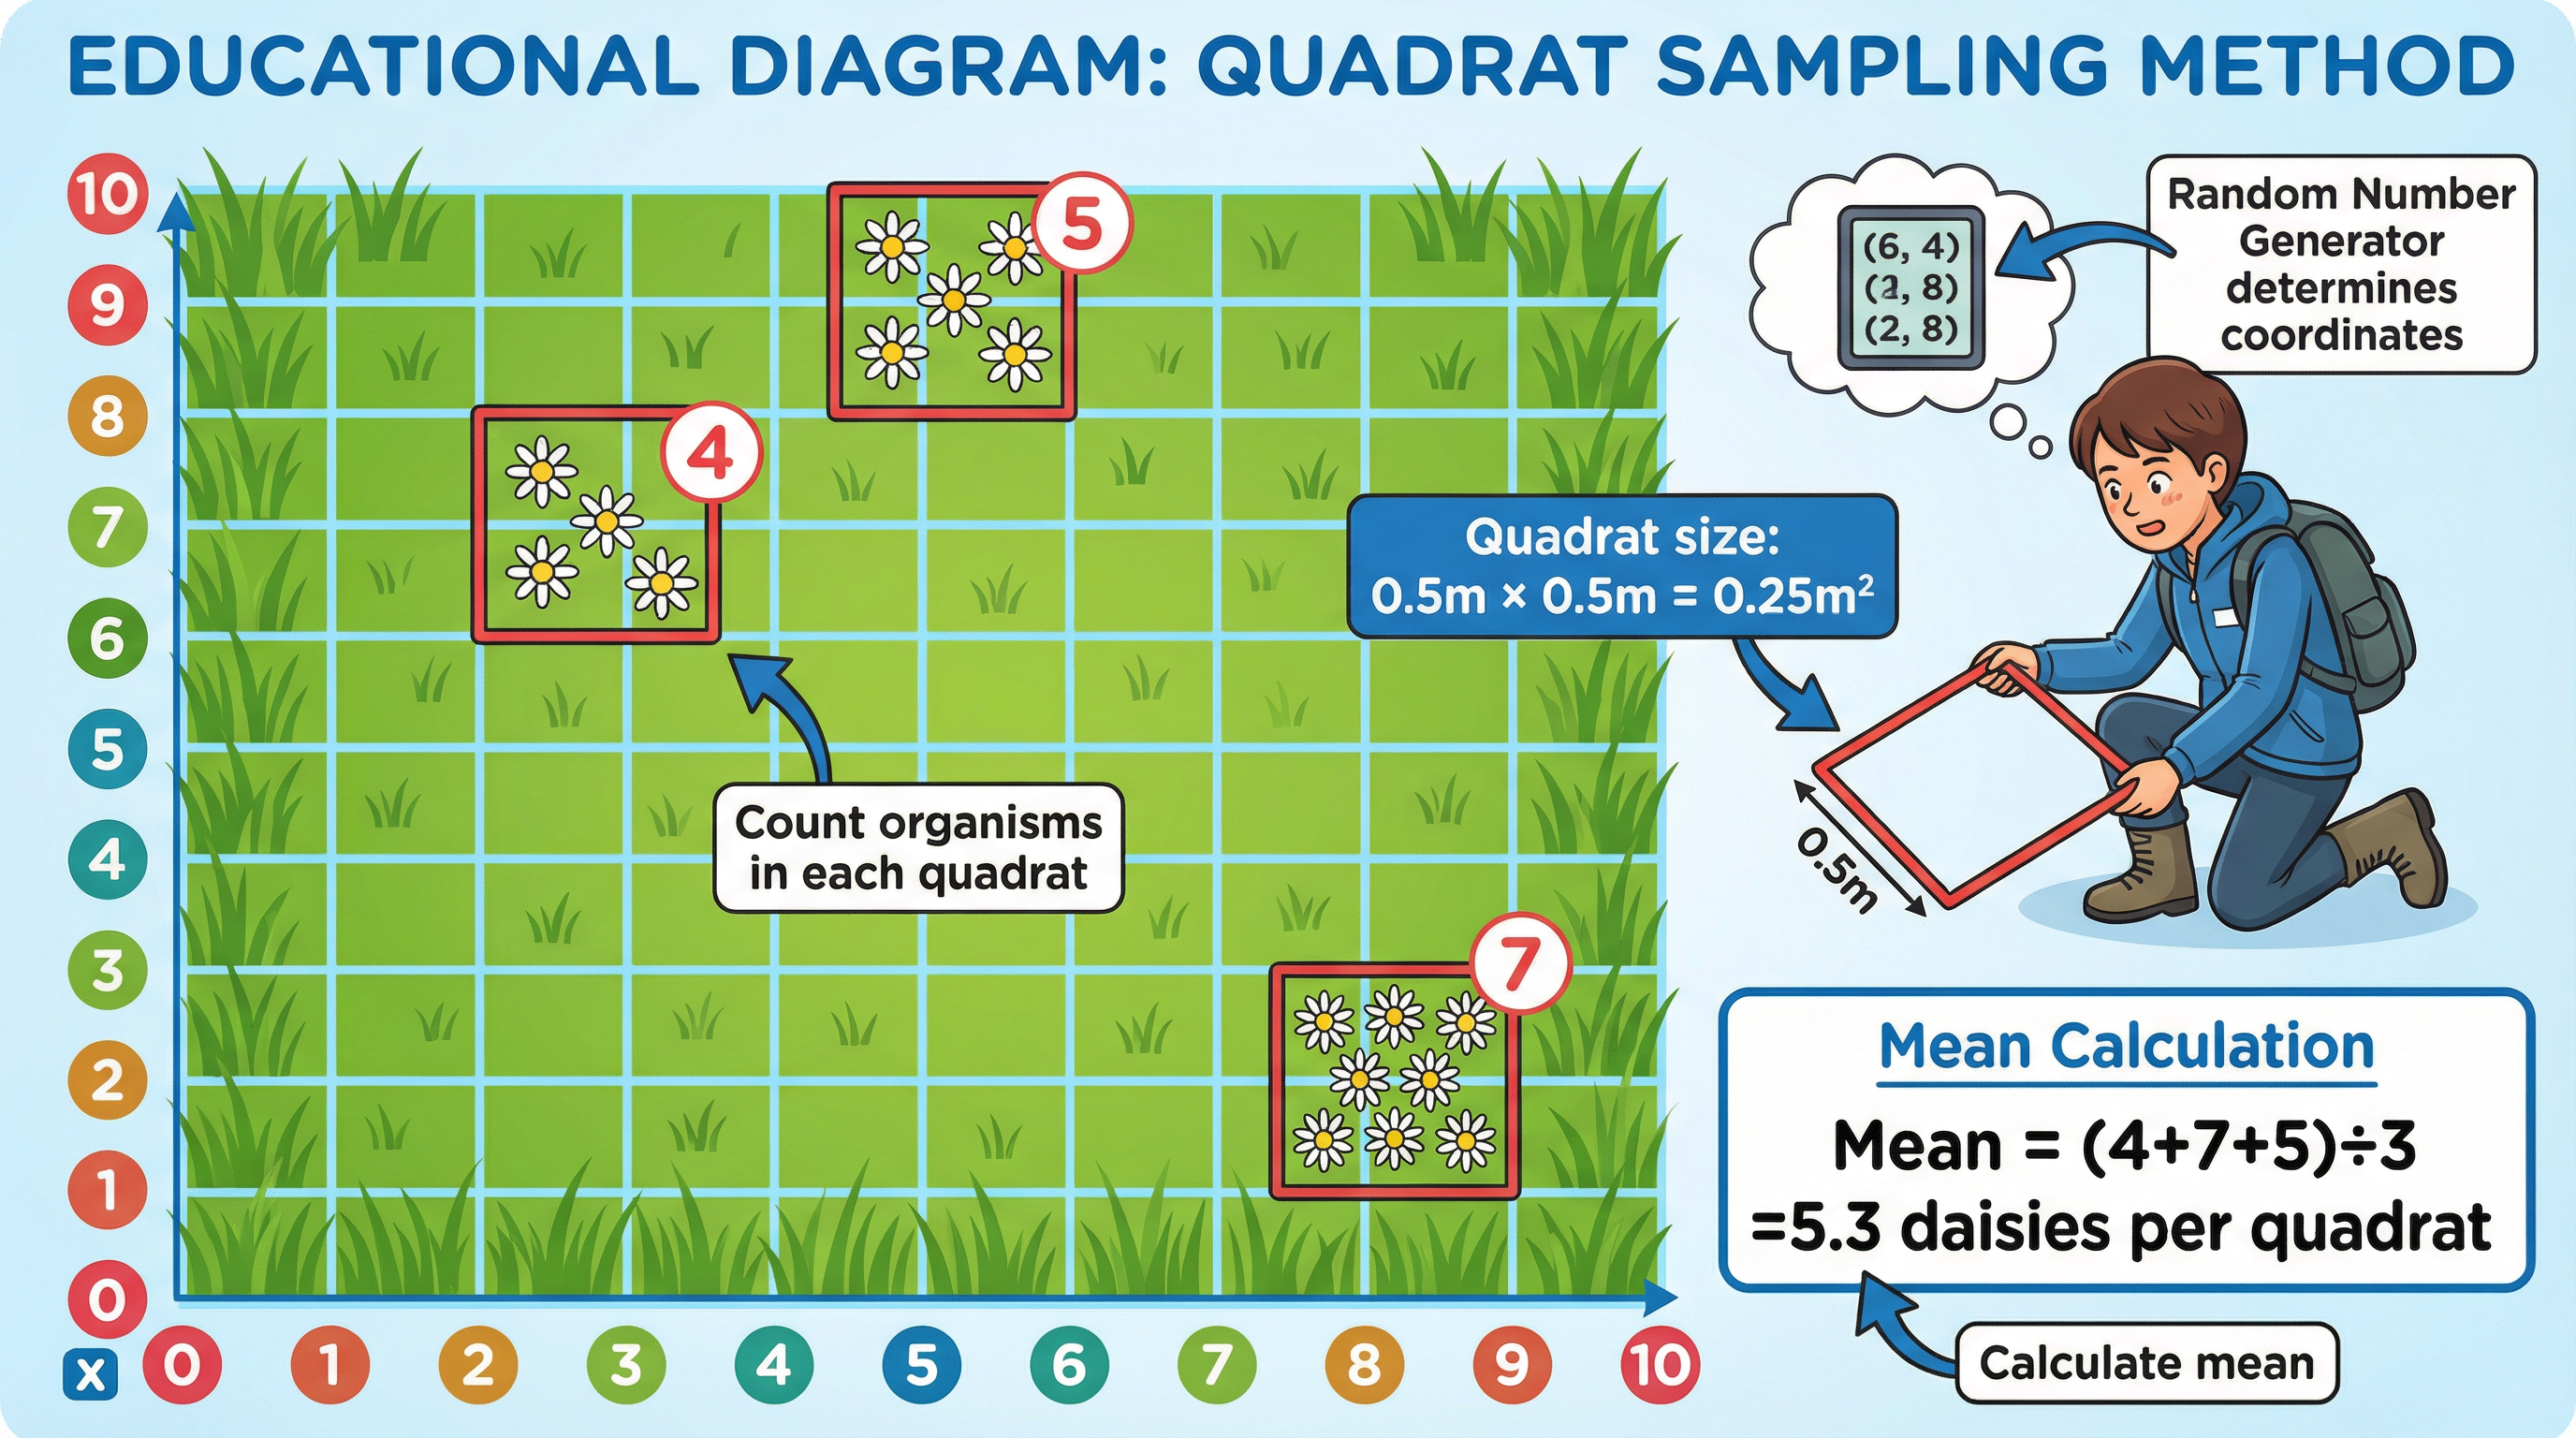
- You use a 0.5m x 0.5m quadrat (Area sampled per quadrat = 0.25 m²).
- You place 10 quadrats and find a mean of 4 daisies per quadrat.
- Total daisies in sampled area = 10 quadrats × 4 daisies/quadrat = 40 daisies.
- Total area sampled = 10 quadrats × 0.25 m²/quadrat = 2.5 m².
- Estimated Population = (5000 m² / 2.5 m²) × 40 = 80,000 daisies.
Practical Applications
PAG 3: Field Investigation into an Ecosystem
Examiners test your understanding of the methodology for sampling organisms.
Apparatus: Quadrat, tape measures, random number generator (or calculator with a random number function).
Method for Random Sampling:
- Create a grid on your sample area using two tape measures as axes.
- Use a random number generator to generate coordinates for where to place the quadrat. This is crucial to avoid bias and secure marks.
- Place the quadrat at the coordinates.
- Count the number of the chosen species within the quadrat.
- Repeat this process a large number of times (e.g., at least 10) to ensure the sample is representative and allows a reliable mean to be calculated.
- Calculate the mean number of organisms per quadrat.
- Use the formula above to estimate the total population size.
Method for Transect Sampling:
Used to investigate how the distribution of organisms changes across an area.
- Lay a tape measure in a line across the habitat (this is the transect).
- Place a quadrat at regular intervals along the transect (e.g., every 2 metres).
- Count the organisms in the quadrat and also measure an abiotic factor (e.g., light intensity using a light meter).
- Repeat at each interval along the transect.
- Plot a graph to show how the distribution of the organism correlates with the abiotic factor.
{{asset:ecosystems_podcast.mp3