Study Notes

Overview
Averages are a fundamental concept in GCSE Mathematics, forming the bedrock of the Statistics content. This topic (Edexcel 5.2) is not just about simple calculation; it is about understanding what each average tells us and, crucially, when to use each one. Examiners will test your ability to handle data presented in lists, frequency tables, and grouped frequency tables. A significant portion of marks, particularly at the Higher tier, are awarded for interpreting and comparing data sets in context, as well as for tackling more complex problems like finding the mean from grouped data or solving 'reverse mean' questions. This guide will equip you with the precise methods and exam techniques required to confidently answer questions on mean, median, and mode, and to understand their connection to measures of spread like the range.
Key Concepts
Concept 1: The Mean
The mean is the most common type of average. It is calculated by adding all the values in a data set together and then dividing by the number of values. It provides a good overall summary of the data because it uses every single value in its calculation. However, this is also its main weakness. The mean is sensitive to outliers – very high or very low values – which can pull the mean in their direction and give a misleading impression of the central tendency. For example, the mean salary in a company could be very high due to one or two executives earning a huge amount, even if most employees are on a much lower wage.
Example: For the data set {4, 5, 5, 7, 9}, the sum is 4 + 5 + 5 + 7 + 9 = 30. There are 5 values, so the mean is 30 ÷ 5 = 6.
Concept 2: The Median
The median is the middle value of a data set after it has been arranged in ascending order. This is a critical first step that many candidates forget, leading to lost marks. If there is an odd number of values, the median is the single middle value. If there is an even number of values, the median is the mean of the two central values. The median's great strength is that it is not affected by outliers, making it a more reliable or 'robust' average when a data set has extreme values.
Example: For the data set {9, 2, 5, 2, 7}, first order it: {2, 2, 5, 7, 9}. The middle value is the 3rd one, which is 5. So, the median is 5.
Concept 3: The Mode
The mode is the value that appears most frequently in a data set. It is the only average that can be used for non-numerical (qualitative) data, such as the most common eye colour. A data set can have one mode (unimodal), more than one mode (bimodal or multimodal), or no mode at all if all values appear with the same frequency. A common error is to state the frequency of the mode as the answer, rather than the modal value itself.
Example: In the data set {Red, Blue, Red, Green, Blue, Red}, the mode is Red, as it appears 3 times, more than any other colour.
Mathematical/Scientific Relationships
Formulas for Averages
-
Mean (from a list):
Mean = Sum of all values / Number of values
This formula must be memorised. -
Median (position in an ordered list):
Position of Median = (n + 1) / 2where 'n' is the number of values.
This formula helps you find the position of the median, not the median itself. It must be memorised. -
Mean (from a Frequency Table):
Mean = Σfx / Σf
Where 'f' is the frequency of a value 'x', and Σ means 'sum of'. This formula is crucial and must be memorised. It involves multiplying each value by its frequency, summing these products, and dividing by the total number of data points (the sum of the frequencies).
Practical Applications
Understanding averages is a key life skill. They are used everywhere to summarise complex information. For example, economists use the mean or median income to understand a country's economic health. In sports, a player's mean number of goals per game is a key performance indicator. In manufacturing, the mean lifetime of a product is tested to ensure quality control. When you read a news article that says the 'average house price' has increased, it's important to ask whether they are using the mean (which could be skewed by mansions) or the median (which gives a better idea of the typical home). This is a real-world example of choosing the appropriate average, a skill directly tested by Edexcel.
Podcast Script
[INTRO - 1 MINUTE]
Hello and welcome to GCSE Maths Mastery! I'm your host, and today we're diving into one of the most exam-critical topics in statistics: averages. Whether you're sitting Foundation or Higher tier, understanding mean, median, and mode is absolutely essential. These concepts appear in nearly every statistics paper, and they're worth serious marks.
Now, I know what you're thinking: "Averages? That's easy!" But here's the thing. Edexcel doesn't just want you to calculate averages. They want you to choose the right one, compare data sets, and solve those tricky reverse mean problems. By the end of this episode, you'll know exactly how to tackle every type of averages question and pick up every single mark available.
So grab your notebook, and let's get started!
[CORE CONCEPTS - 5 MINUTES]
Let's start with the basics. There are three types of average you need to know: mean, median, and mode. Each one tells you something different about your data.
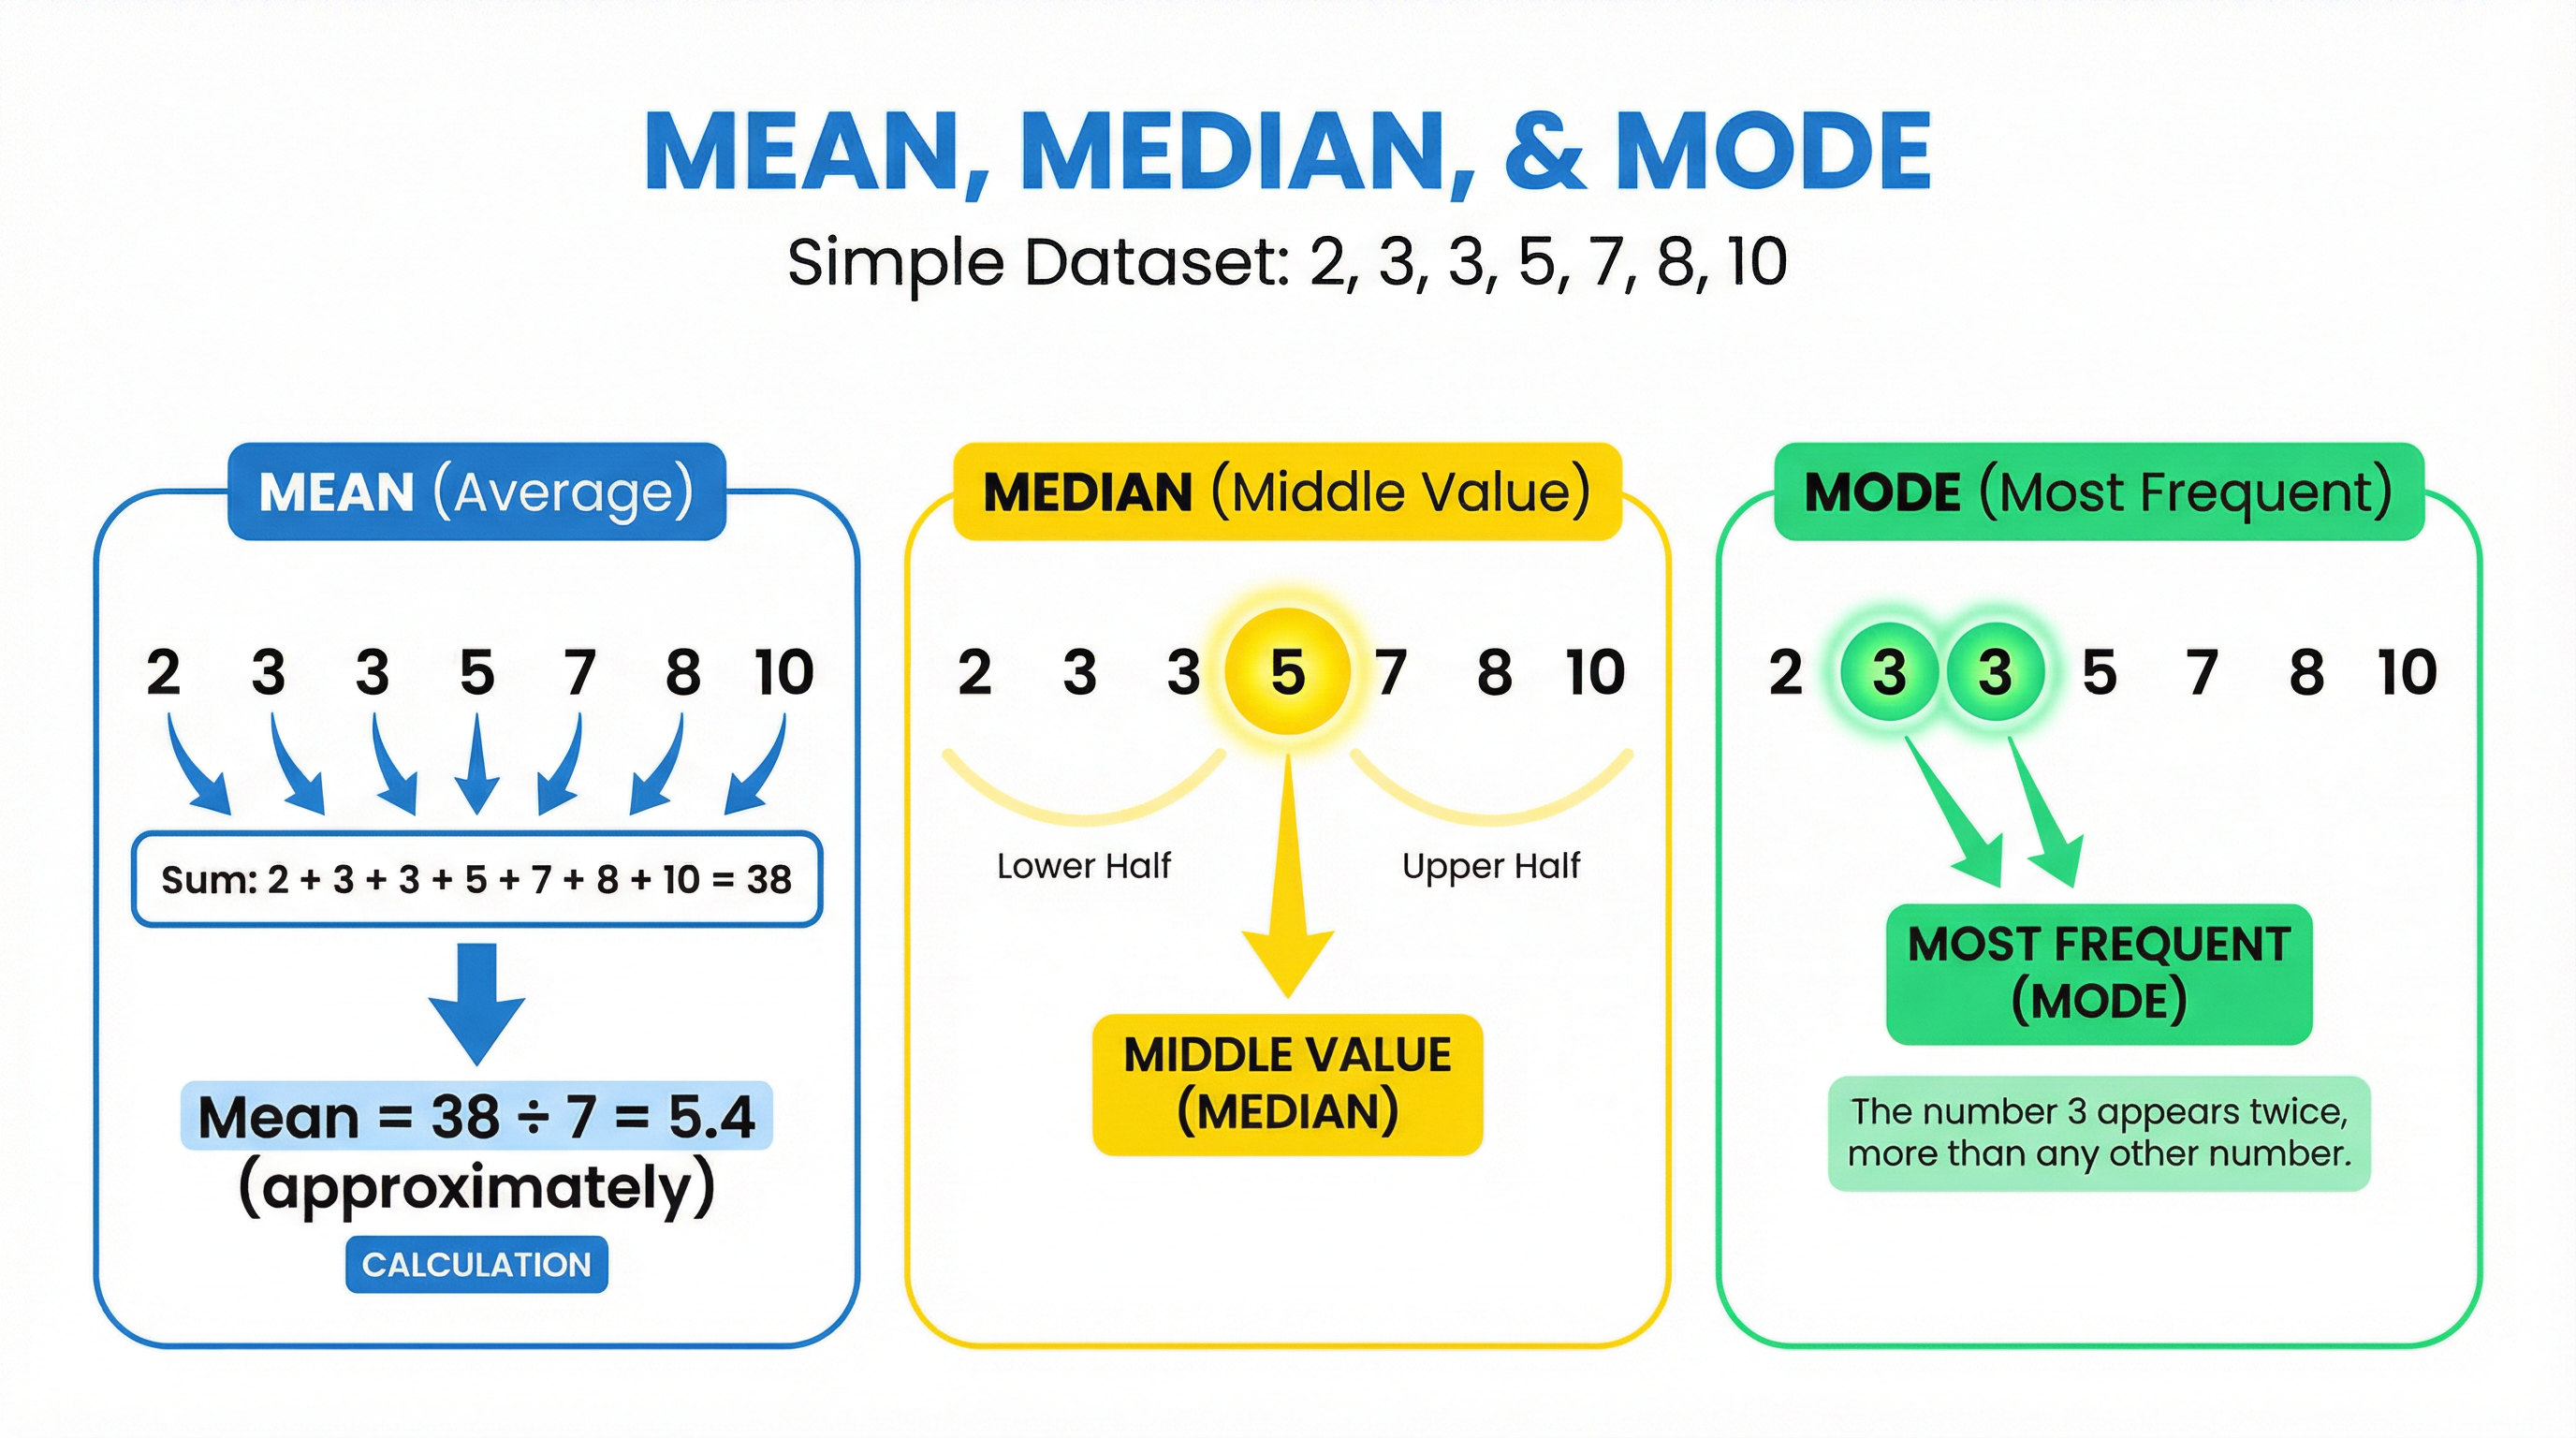
The mean is what most people call "the average." You add up all the values and divide by how many values you have. For example, if you have the numbers 2, 3, 3, 5, 7, 8, and 10, you add them all up to get 38, then divide by 7. That gives you 5.4 approximately. The mean is great because it uses all the data, but it has one big weakness: it's affected by extreme values. If one number is really high or really low, it can skew the mean.
The median is the middle value when you put all your numbers in order. This is crucial: you MUST order the data first. I can't stress this enough. Edexcel will give you an unordered list, and if you just pick the middle number without ordering, you'll lose marks. So, with our numbers 2, 3, 3, 5, 7, 8, 10, the middle value is 5. That's your median. If you have an even number of values, you take the mean of the two middle numbers. The median is brilliant when you have outliers because it's not affected by extreme values.
The mode is the most frequent value, the one that appears most often. In our dataset, the number 3 appears twice, more than any other number, so 3 is the mode. You can have more than one mode, or no mode at all if all values appear the same number of times. Here's a common mistake: students often write the frequency instead of the actual value. If 3 appears twice, the mode is 3, not 2!
Now, let's talk about frequency tables. This is where things get more interesting. When you're given a frequency table, you can't just add up the data values and divide by the number of rows. That's the number one error I see. Instead, you need to multiply each value by its frequency, add all those products together, then divide by the total frequency. We write this as: mean equals the sum of f times x, divided by the sum of f.
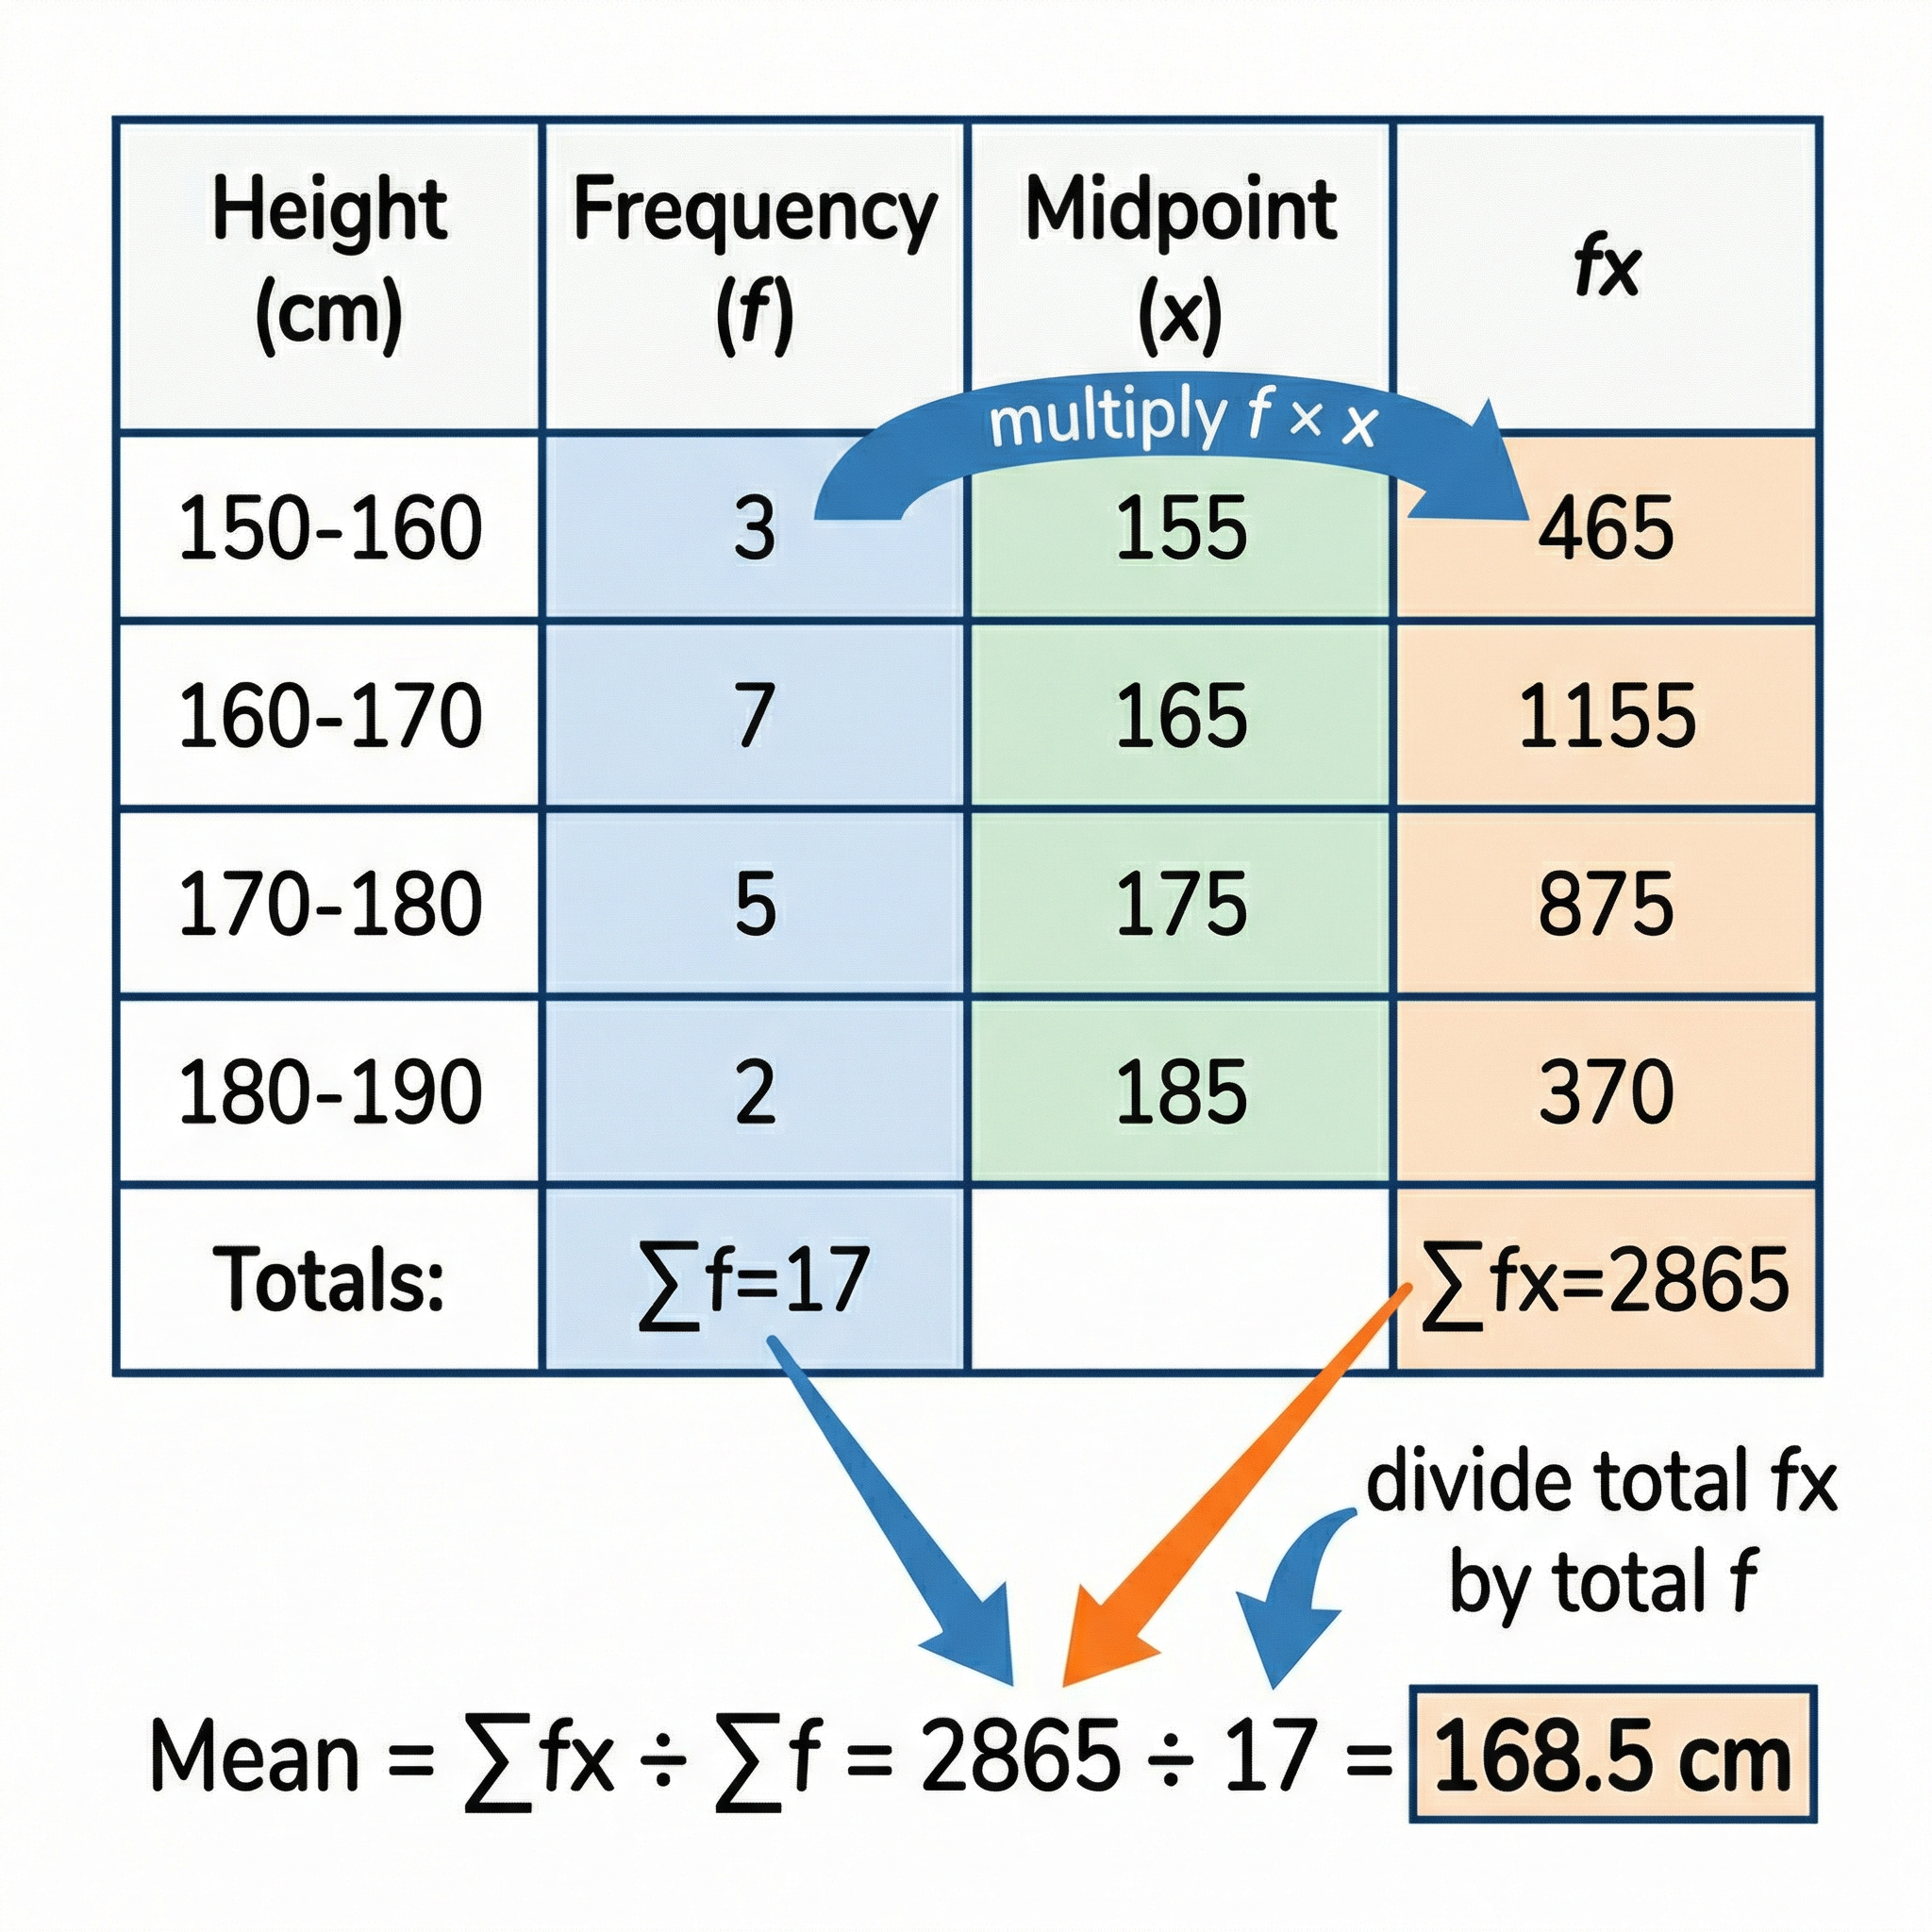
For grouped frequency tables, like heights in ranges, you use the midpoint of each group. So if you have 150 to 160 centimeters, the midpoint is 155. Then you multiply each midpoint by its frequency, add them all up, and divide by the total frequency. Always show your working with a midpoint column and an f times x column. Even if your final answer is wrong, you'll get method marks for showing these steps.
[EXAM TIPS & COMMON MISTAKES - 2 MINUTES]
Right, let's talk exam technique. This is where you can really boost your marks.
First, command words. If the question says "Compare," you MUST make two statements: one about the average and one about the spread. For example: "Team A has a higher mean score, so they performed better overall. Team A has a lower range, so they were more consistent." That's two separate comments, and you need both to get full marks.
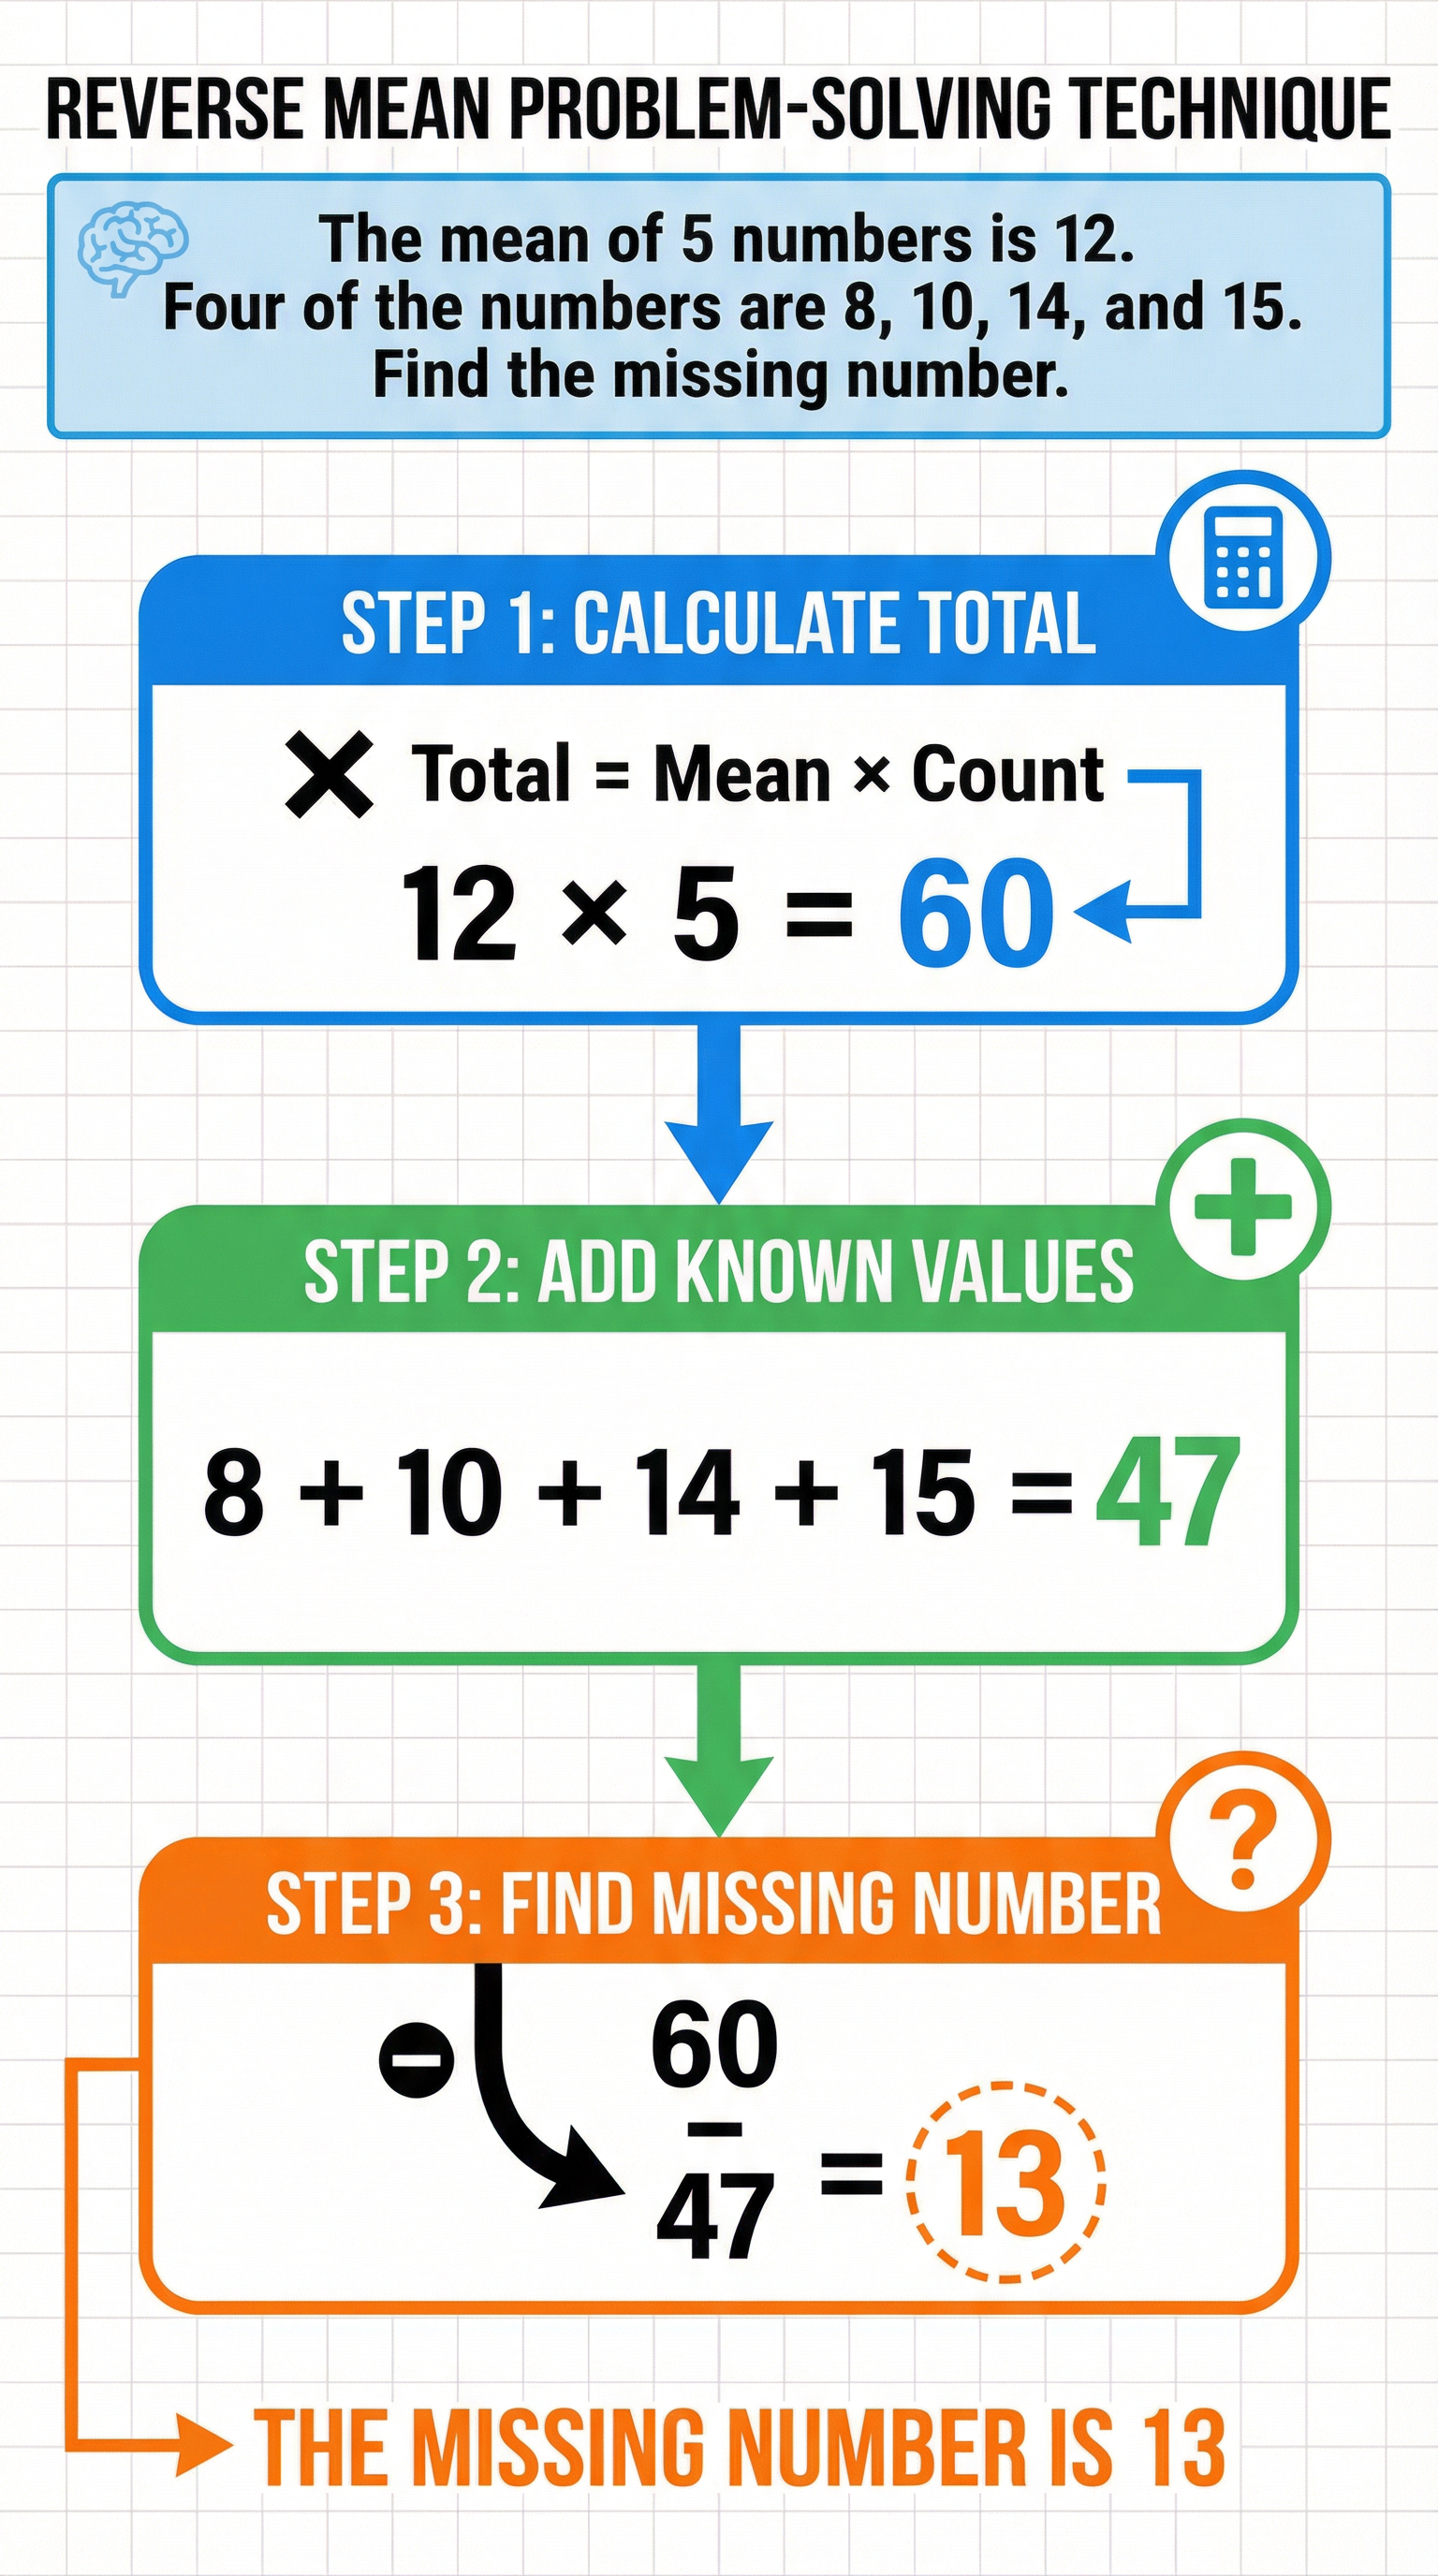
Second, reverse mean problems. These are Higher tier favorites. The question will say something like: "The mean of five numbers is 12. Four of the numbers are 8, 10, 14, and 15. Find the missing number." Here's the technique: immediately calculate the total. Mean times count equals total, so 12 times 5 equals 60. That's your total. Then add up the known values: 8 plus 10 plus 14 plus 15 equals 47. Finally, subtract: 60 minus 47 equals 13. The missing number is 13. This technique works every time.
Third, choosing the appropriate average. If the question asks which average is most appropriate and the data has extreme outliers, always say the median, because it's not affected by extreme values. That's the key phrase examiners want to see.
Finally, always show your working. Even if you make a calculation error, you can still get method marks for setting up the problem correctly.
[QUICK-FIRE RECALL QUIZ - 1 MINUTE]
Okay, time to test yourself! I'll ask three questions. Pause after each one and try to answer.
Question 1: What must you do before finding the median of a data set?
Answer: Order the data from smallest to largest.
Question 2: In a frequency table, what formula do you use to find the mean?
Answer: Sum of f times x, divided by sum of f.
Question 3: If a question asks you to compare two data sets, how many statements must you make?
Answer: Two statements, one about the average and one about the spread.
How did you do? If you got all three, brilliant! If not, go back and review those sections.
[SUMMARY & SIGN-OFF - 1 MINUTE]
Let's wrap up. Today we've covered the three types of average: mean, median, and mode. We've looked at how to calculate them from lists and frequency tables. We've tackled reverse mean problems and learned the crucial exam technique for comparison questions.
Remember: order your data before finding the median, show your midpoint and f times x columns for grouped data, and always make two statements when comparing data sets.
Averages might seem simple, but they're a goldmine for marks if you know the techniques. Practice these methods, watch out for those common mistakes, and you'll be absolutely fine in your exam.
Thanks for listening to GCSE Maths Mastery. Keep practicing, stay confident, and I'll see you in the next episode. Good luck!