Study Notes
Overview
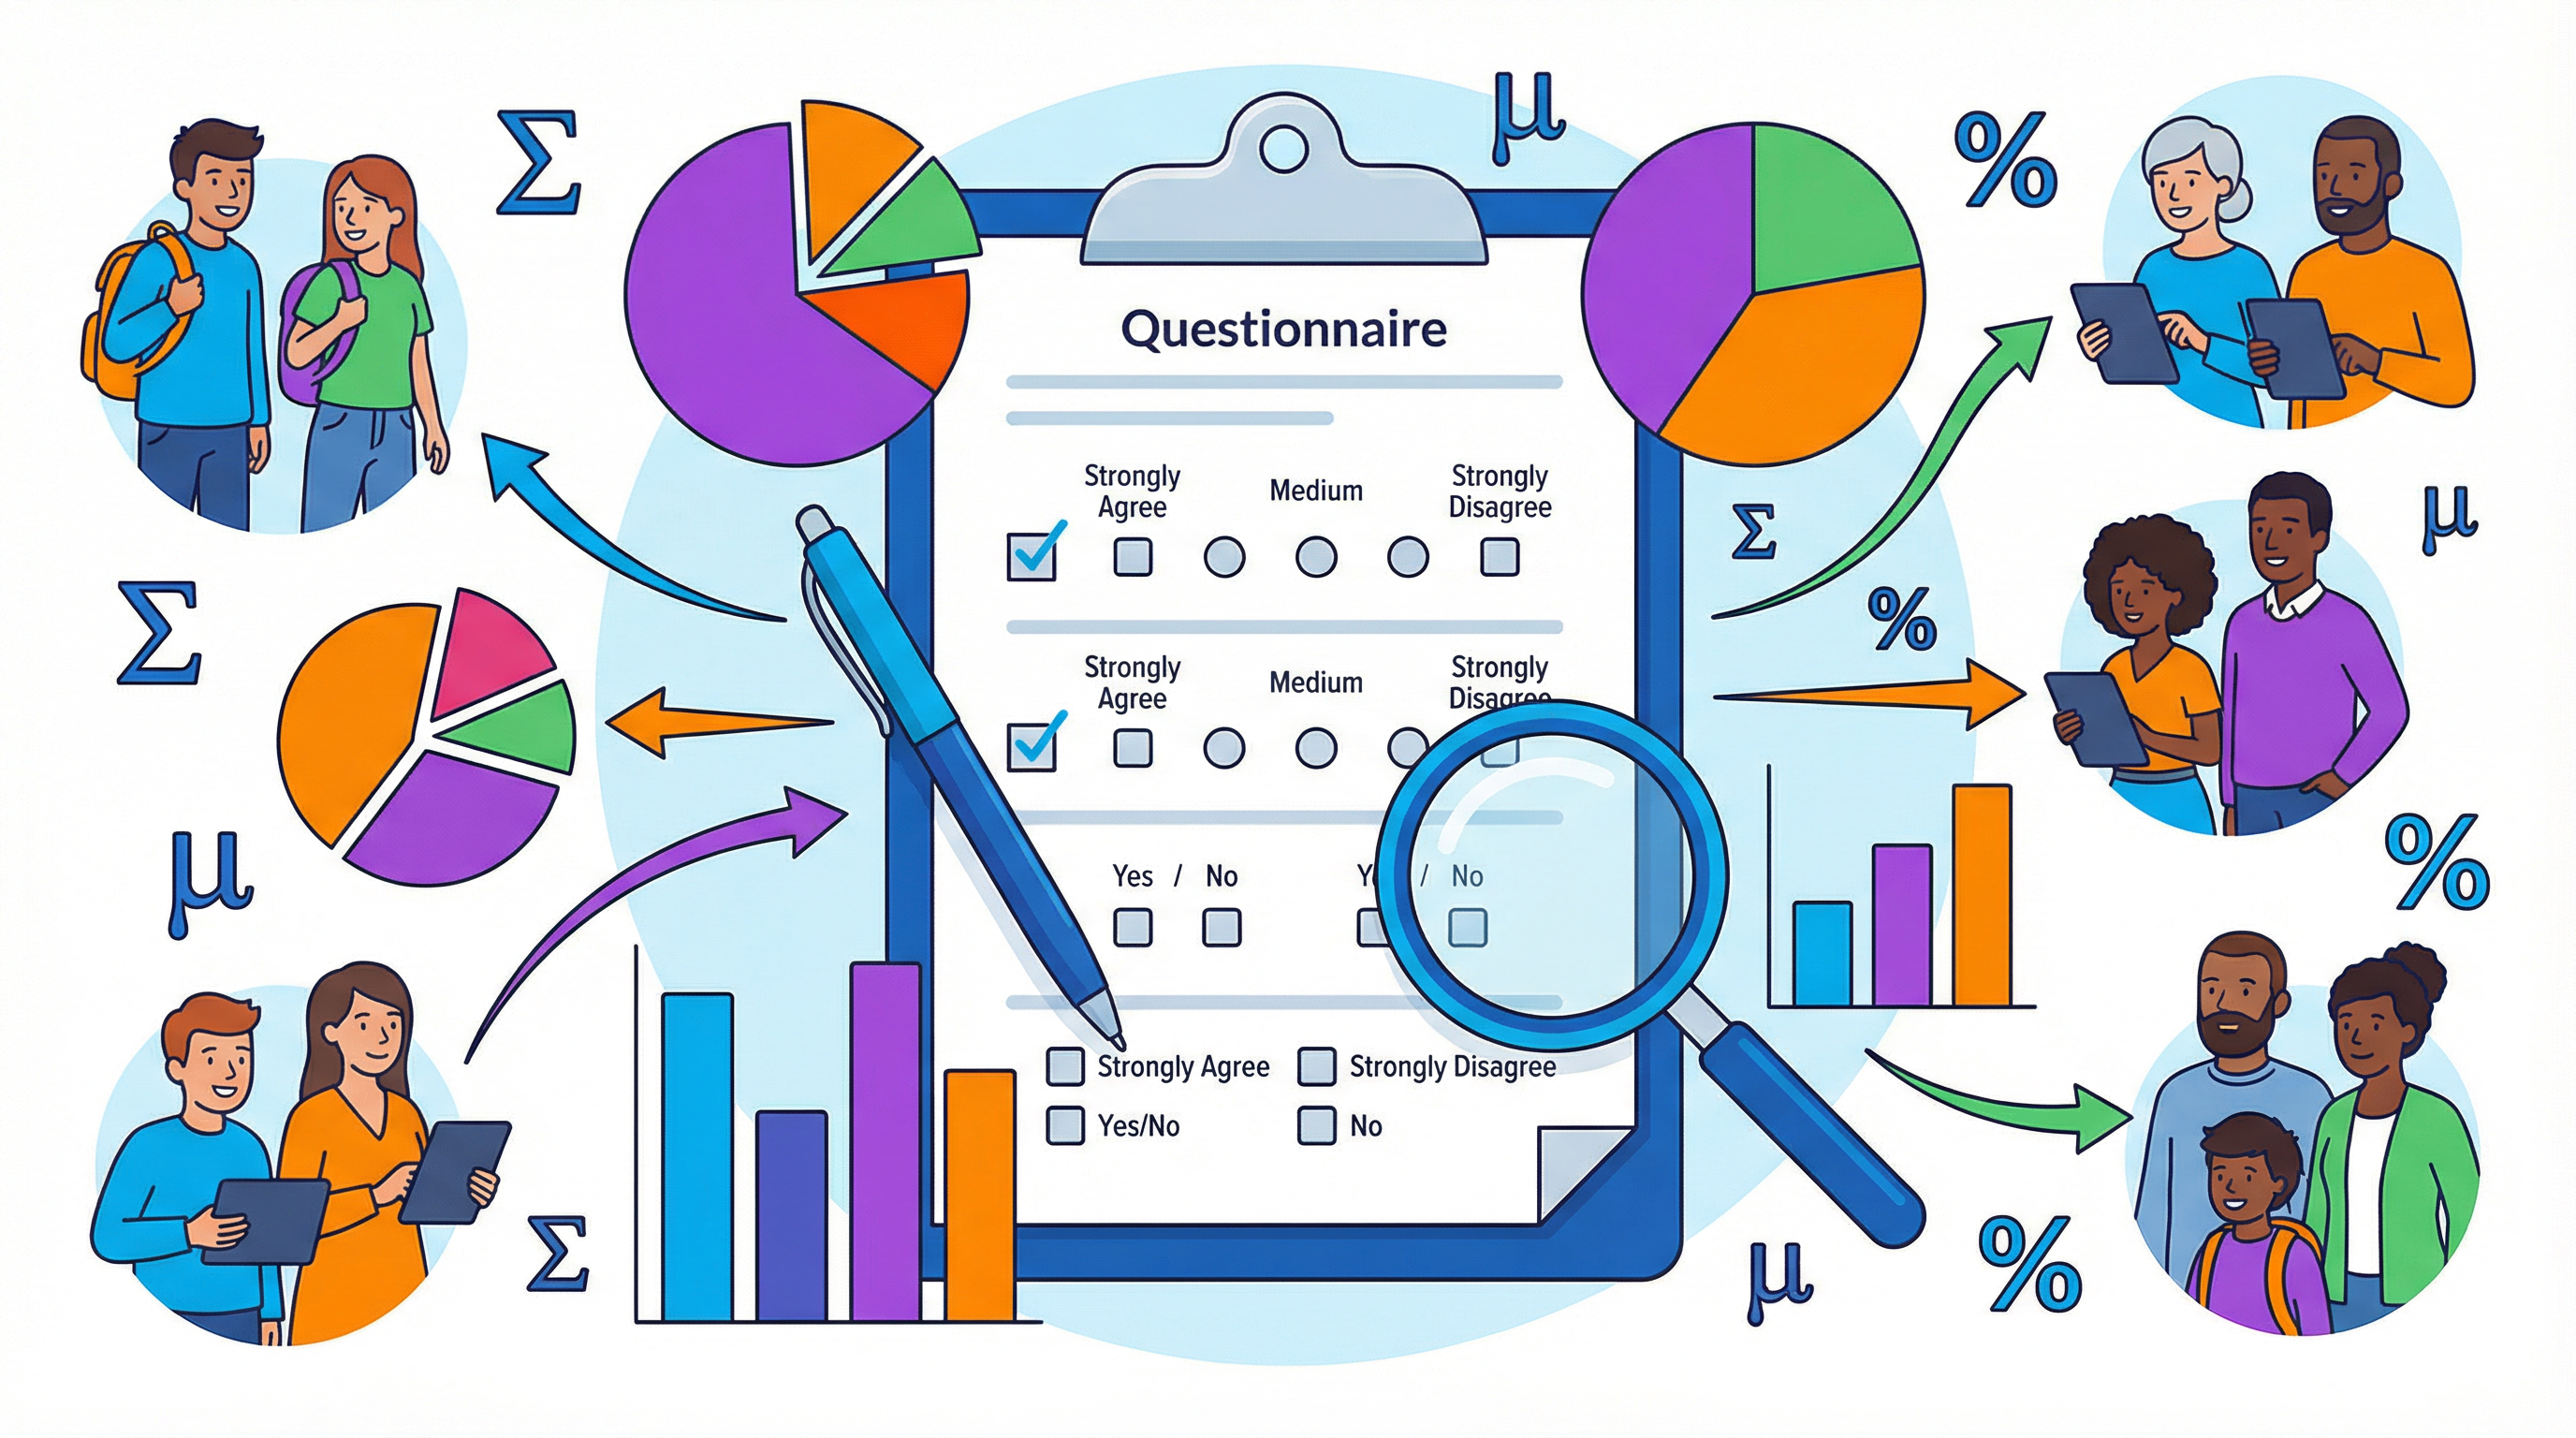
Welcome to the essential guide for WJEC GCSE Mathematics topic 4.1: Data Collection. This topic is fundamental to understanding how we gather and interpret information about the world around us. In your exam, you will be tested on your ability to critically evaluate data collection methods, design effective questionnaires, and use sampling techniques to create representative datasets. This is a highly practical area of mathematics, and examiners are looking for candidates who can apply their knowledge to real-world scenarios. You will often see questions that ask you to identify bias, correct poorly designed questions, or calculate sample sizes. Mastering these skills is crucial as they not only secure marks in this section but also link to data representation and analysis topics like charts and averages.
Key Concepts
Concept 1: Designing Effective Questionnaires
A questionnaire is a tool for collecting information. To earn marks, your questions must be clear, unambiguous, and designed to collect the specific data you need. WJEC examiners focus on two key features:
-
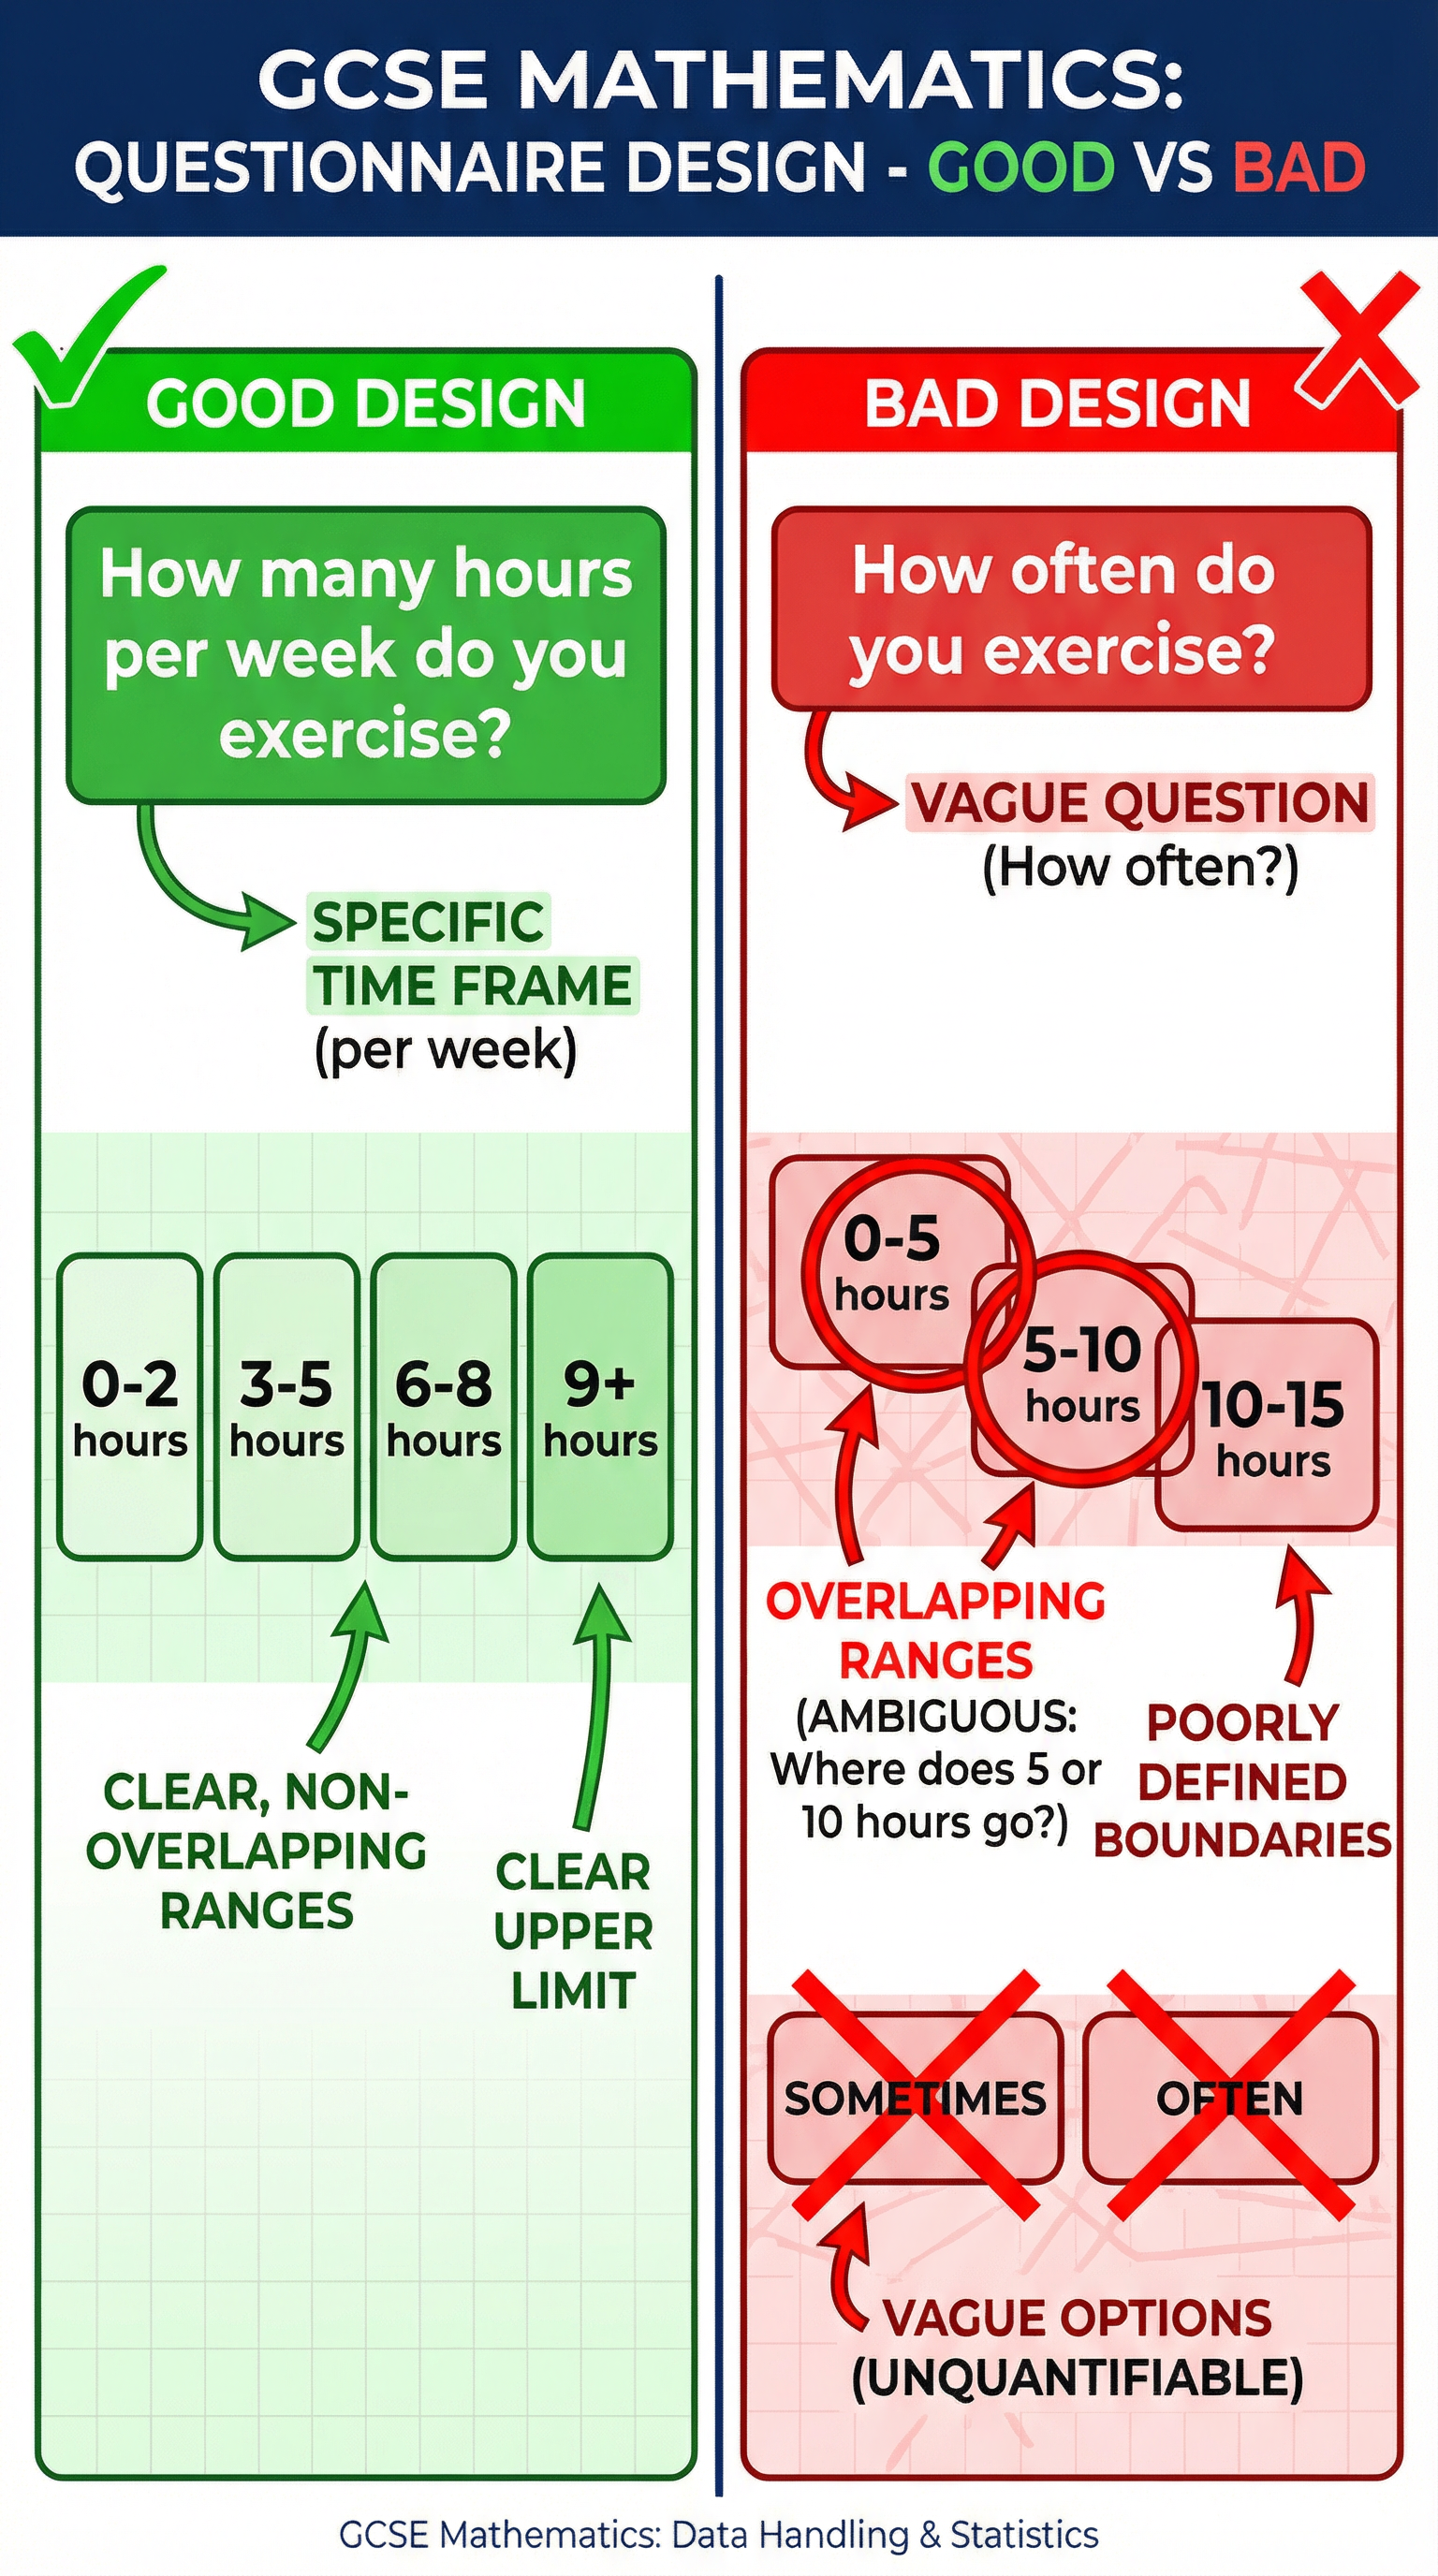
Specific Time Frame: Questions about frequency must be constrained to a specific period. Vague terms like 'often' or 'sometimes' are not acceptable as they are subjective. You must provide a clear time frame to ensure every respondent is answering on the same basis.
- Bad Example: How often do you read?
- Good Example: How many books did you read in the last month?
-
Non-Overlapping and Exhaustive Response Boxes: The options you provide must cover all possible answers without any ambiguity.
- Non-overlapping: A respondent must not be able to select two different boxes for a single answer. For example, boxes labelled '0-5' and '5-10' are flawed because a person who answers '5' could tick either box.
- Exhaustive: The boxes must cover every possible answer. This usually means including a box for '0' and an open-ended upper category like '10 or more'.
Concept 2: Sampling Methods
Sampling is the process of selecting a subset of a population to represent the whole group. The goal is to create a representative sample that accurately reflects the characteristics of the entire population.
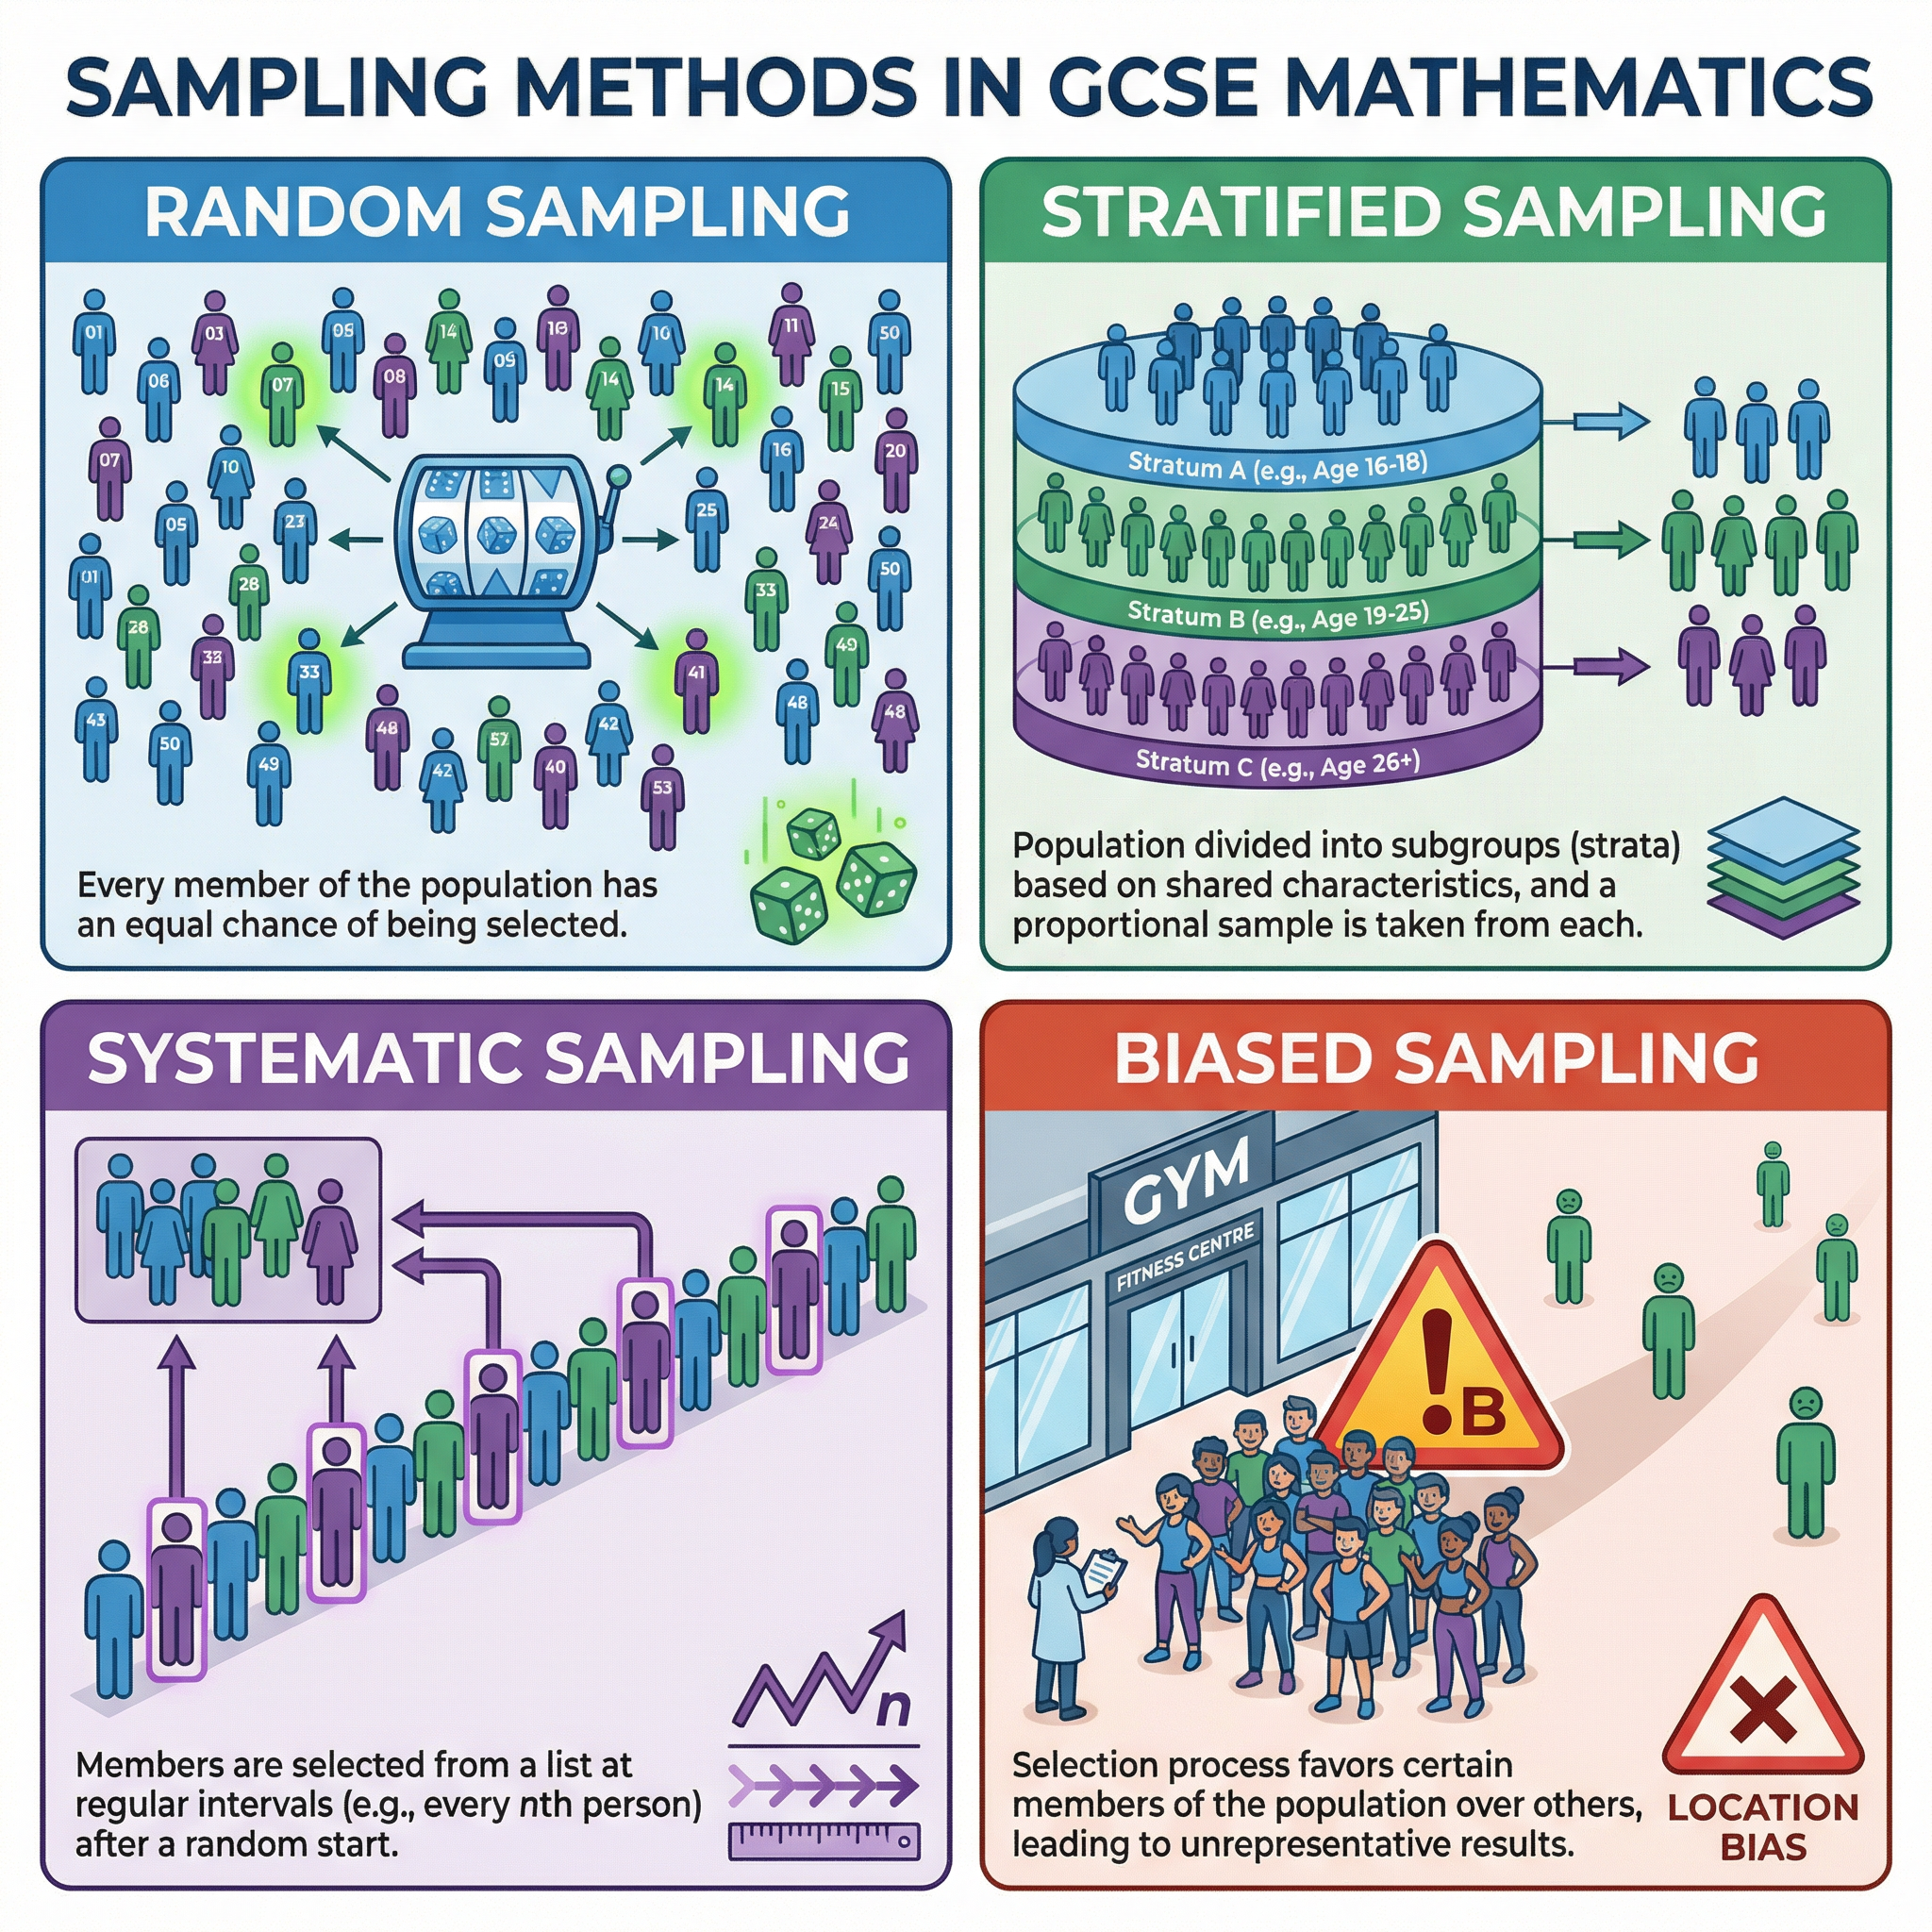
- Random Sampling: Every individual in the population has an equal chance of being selected. This can be done using a random number generator or drawing names from a hat. It is fair but may not always create a perfectly representative sample by chance.
- Systematic Sampling: You select members at regular intervals from an ordered list (e.g., every 10th person). You must start from a random point. This is straightforward but can be biased if the list has a hidden pattern.
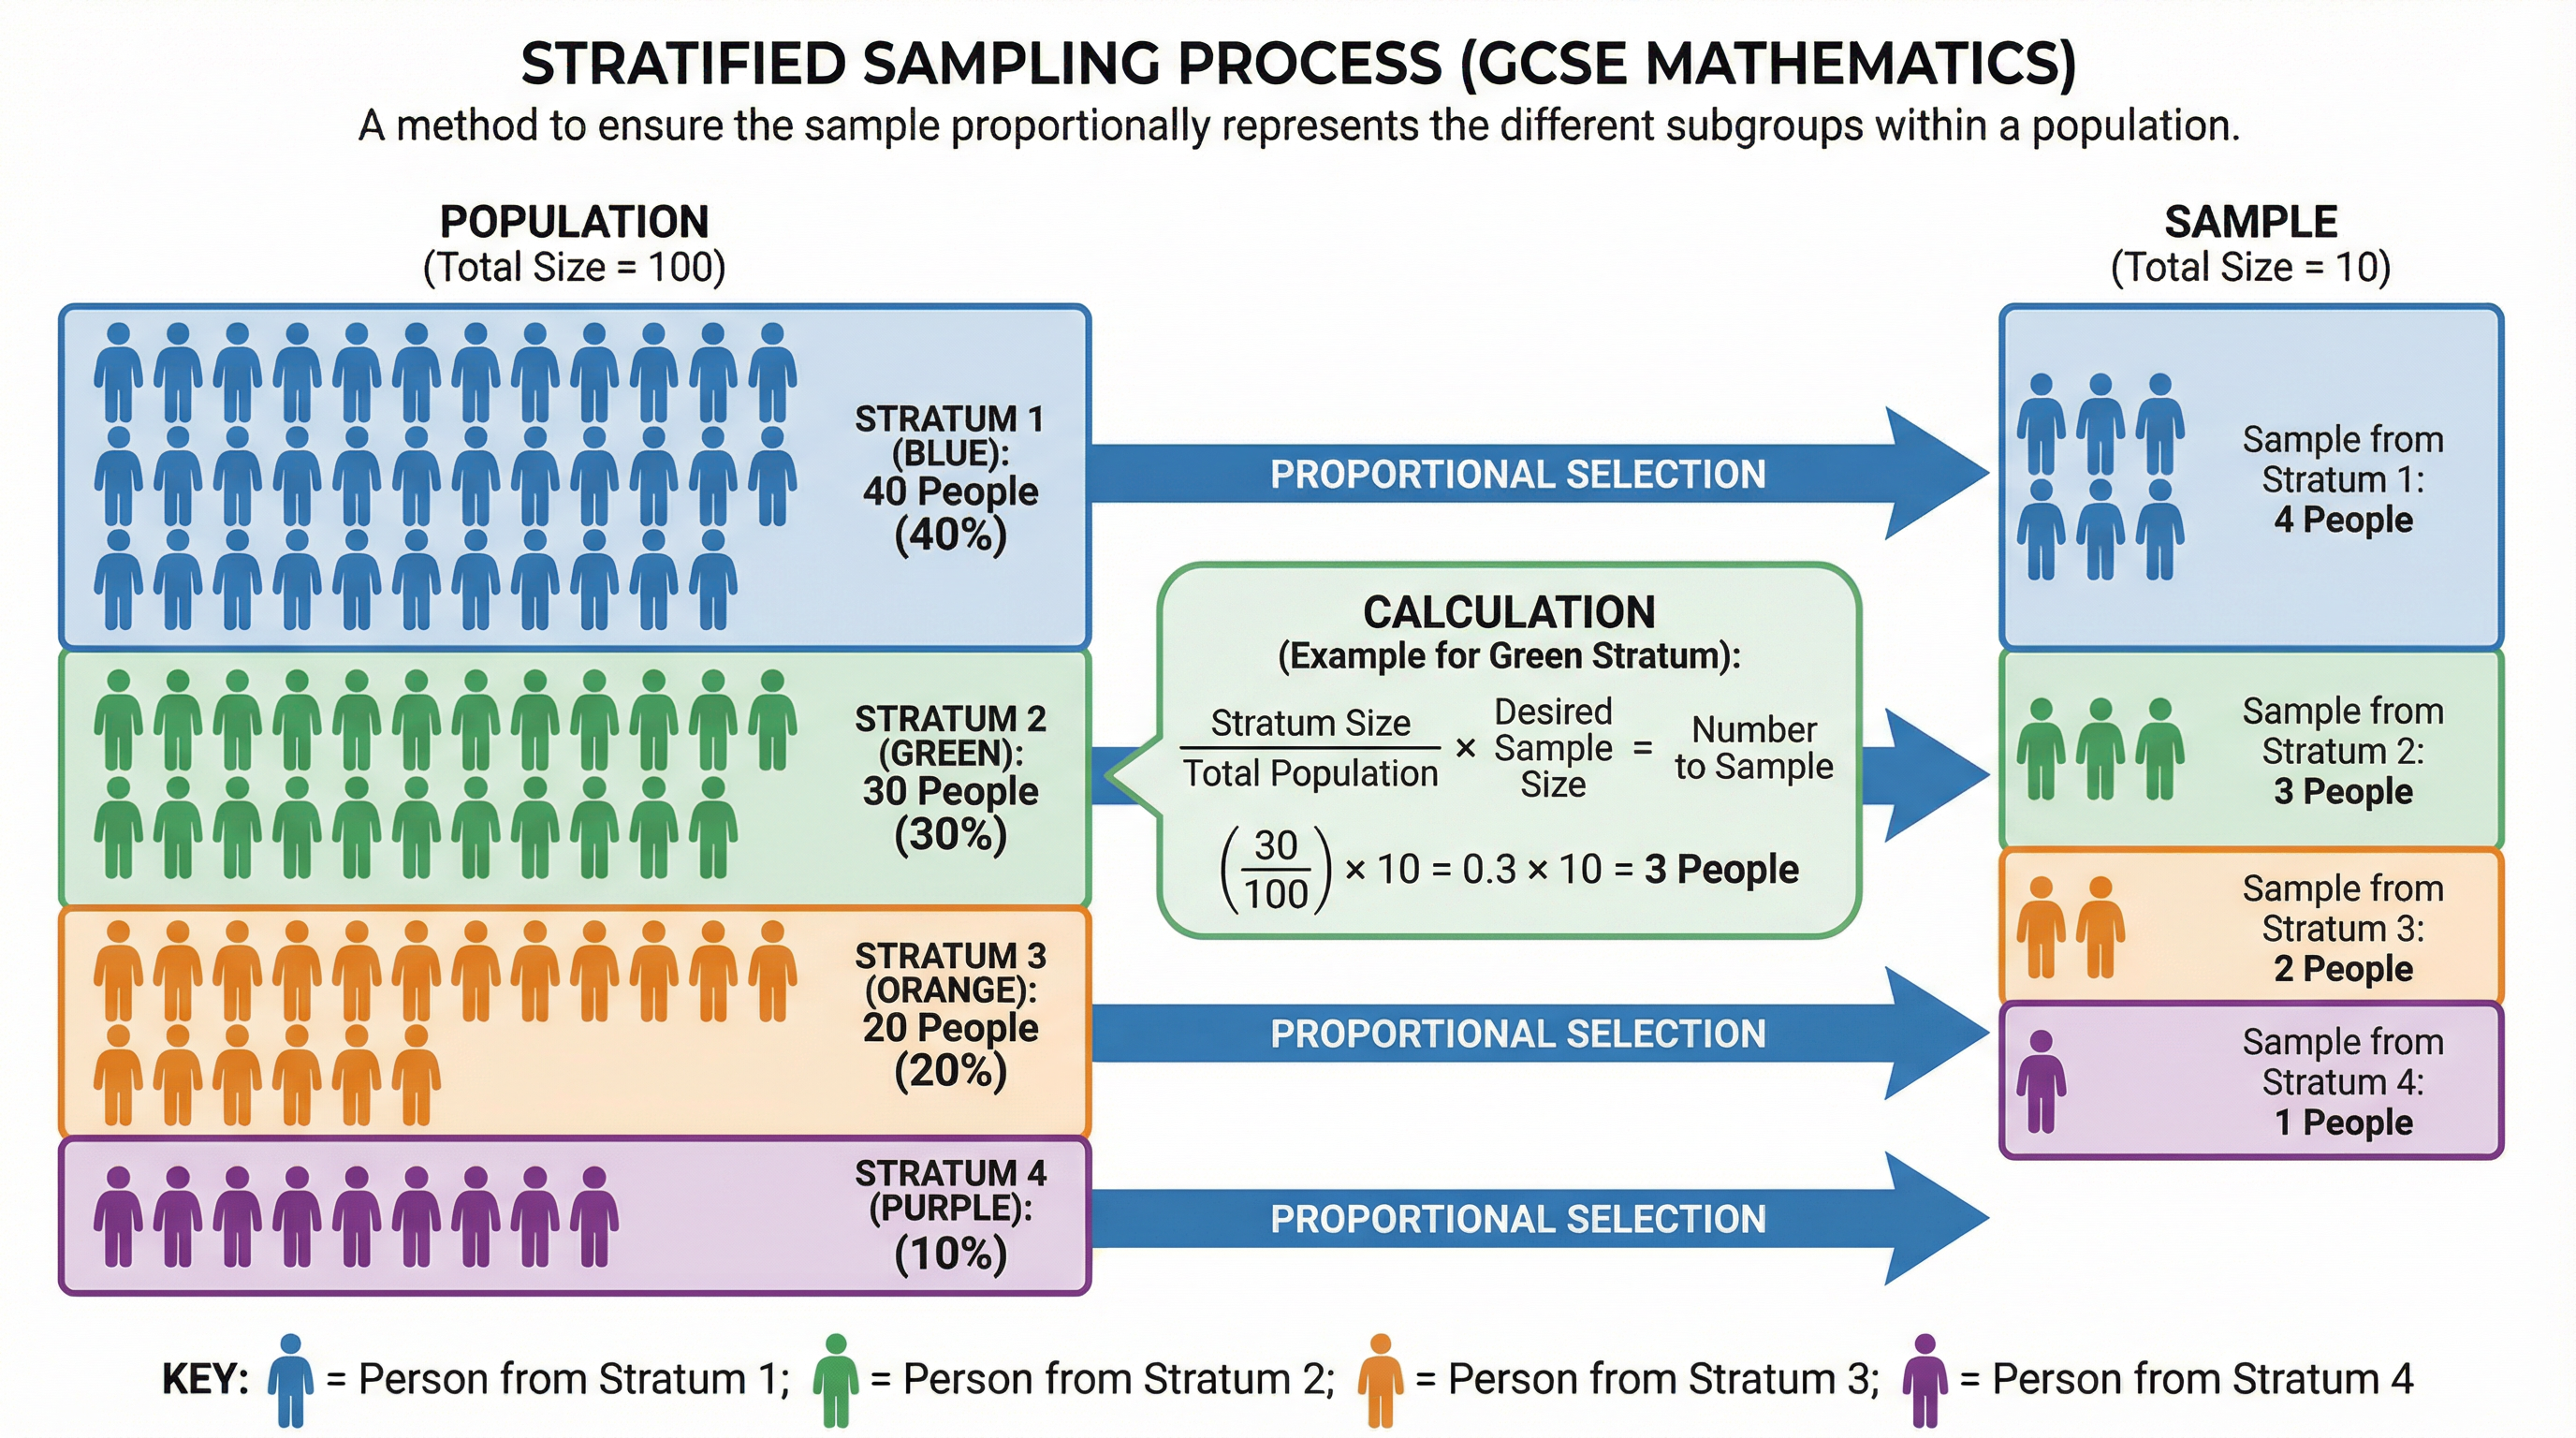
- Stratified Sampling: This is a more advanced method that ensures subgroups (strata) within a population are represented proportionally. You divide the population into strata based on a shared characteristic (e.g., age, gender, year group) and then calculate the number of people to sample from each stratum to reflect its proportion in the overall population.
Concept 3: Identifying and Avoiding Bias
Bias is a systematic error in sampling or testing that results in a sample that is not representative of the population. A biased sample leads to inaccurate conclusions. Examiners will often ask you to identify sources of bias.
- Location/Timing Bias: The place or time a survey is conducted can influence the results. For example, surveying people outside a gym about their fitness habits will likely over-represent people who exercise regularly.
- Leading Questions: A question phrased in a way that suggests a particular answer is a leading question (e.g., "Don't you agree that school holidays are too short?").
- Self-Selection Bias: This occurs when individuals volunteer to participate in a survey. Volunteers may have stronger opinions or be more interested in the topic than the general population.
Mathematical/Scientific Relationships
Stratified Sampling Formula
This formula is essential and must be memorised. It is not given on the formula sheet.
Number to sample from a stratum = (Size of stratum / Size of total population) x Total sample size
- Size of stratum: The number of individuals in the specific subgroup.
- Size of total population: The total number of individuals in all strata combined.
- Total sample size: The desired number of individuals in the final sample.
Example Calculation:
A university has 2000 students: 1200 undergraduate and 800 postgraduate. A sample of 100 students is required.
- Undergraduate sample: (1200 / 2000) x 100 = 0.6 x 100 = 60 students
- Postgraduate sample: (800 / 2000) x 100 = 0.4 x 100 = 40 students
Practical Applications
Data collection skills are used everywhere:
- Market Research: Companies use questionnaires and sampling to understand consumer preferences and test new products.
- Government Surveys: The census is a large-scale data collection exercise to gather information about the population, which informs policy on housing, healthcare, and transport.
- Scientific Studies: Researchers use sampling to study the effects of treatments or interventions on a population without needing to test everyone.