
Study Notes
Overview
Probability is the language of uncertainty, a fundamental concept in mathematics that allows us to quantify the likelihood of an event occurring. For your OCR GCSE exam, this topic (4.2) is not just about flipping coins; it's about building logical models to understand everything from genetic inheritance to financial risk. Examiners will test your ability to move fluently between different representations of probability, including fractions, decimals, and percentages. You will be expected to tackle multi-stage problems using tools like tree diagrams and Venn diagrams, and for Higher tier candidates, to grapple with the more abstract challenges of conditional probability and algebraic problems. This topic has strong synoptic links to fractions, decimals, percentages, and ratio, meaning a solid understanding here will bolster your performance across the entire paper. Expect to see questions ranging from quick 2-mark calculations to more demanding 6-mark problem-solving questions that require you to structure a logical argument.
Key Concepts
Concept 1: The Probability Scale & Basic Calculation
At its heart, probability is a measure on a scale from 0 to 1. An event with a probability of 0 is impossible, while an event with a probability of 1 is certain. All other probabilities lie between these two values. The core formula, which you must know, is:
P(Event) = Number of favourable outcomes / Total number of possible outcomesThis formula is the foundation for most of the probability questions you will encounter. For example, the probability of rolling a 4 on a standard six-sided die is 1/6, as there is only one '4' (favourable outcome) and six possible faces in total.
It is also crucial to understand the concept of complementary events. The probability of an event not happening is 1 minus the probability that it does happen. This is written as P(not A) = 1 - P(A). This is an incredibly useful shortcut, especially for 'at least one' style questions.
Concept 2: Tree Diagrams for Successive Events
When an exam question involves more than one event happening in sequence (e.g., picking two counters from a bag), a tree diagram is your most powerful tool. It provides a systematic way to list all possible outcomes and their associated probabilities.
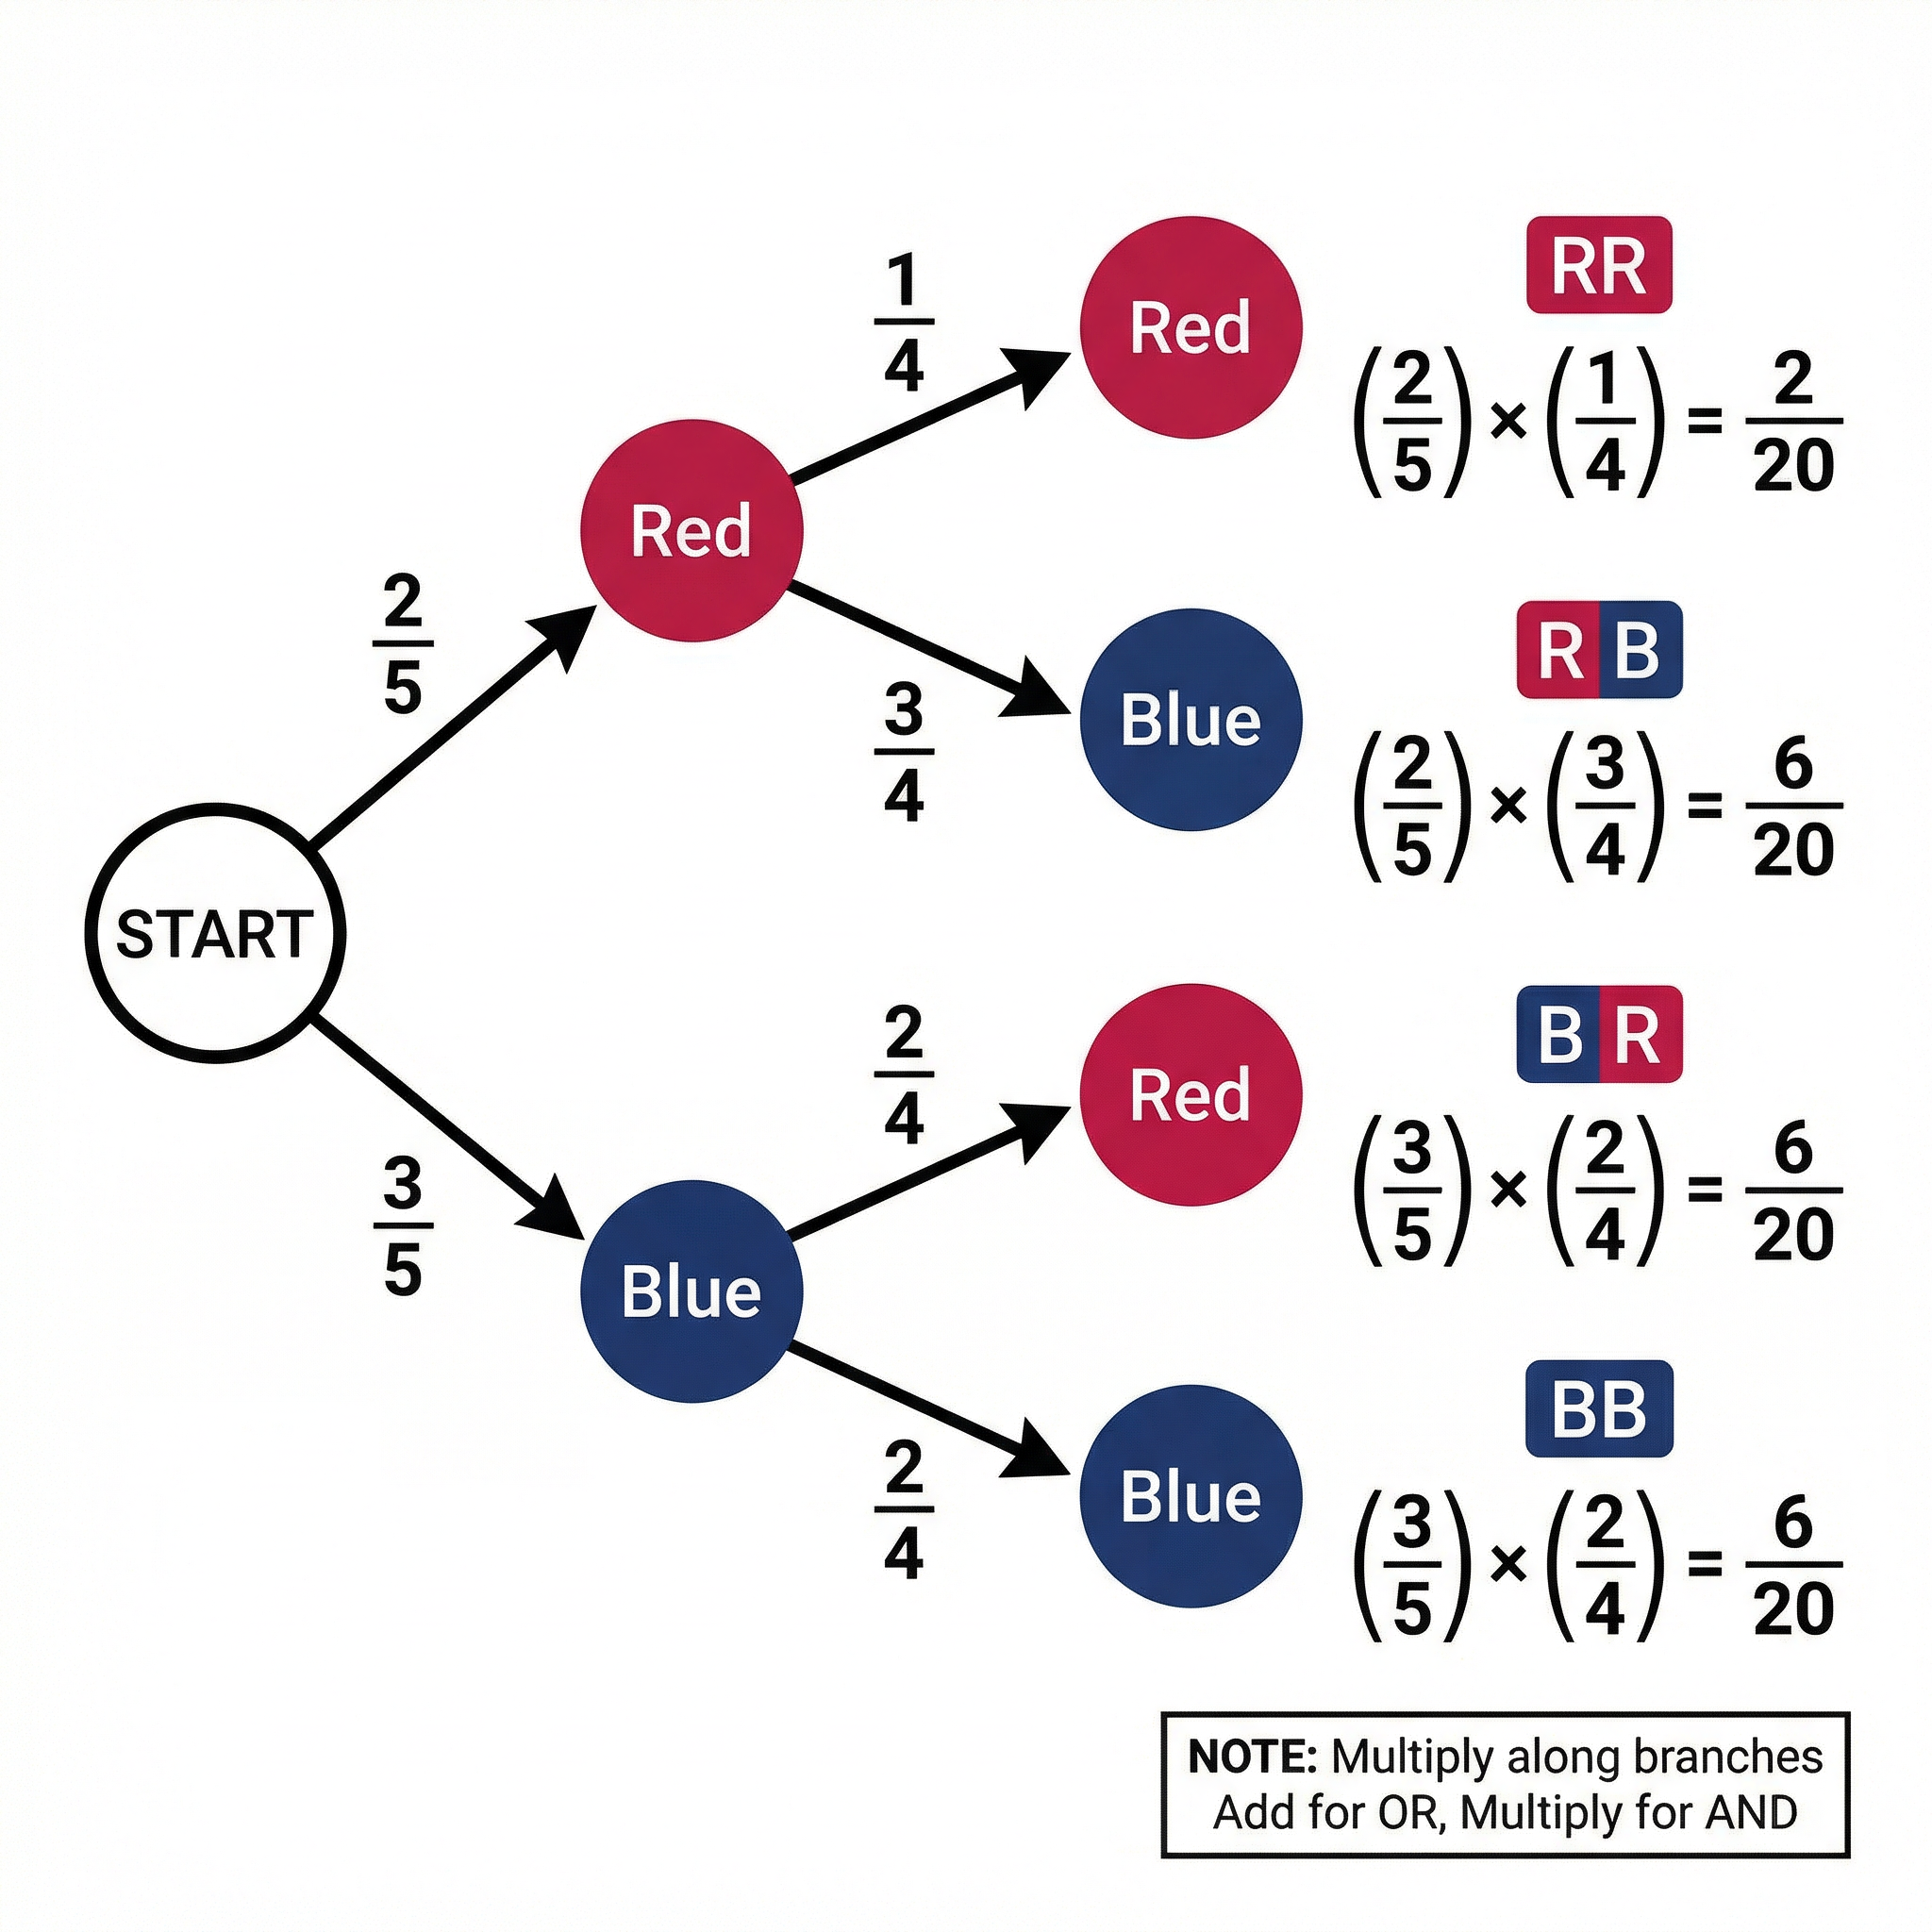
There are two golden rules for tree diagrams:
- The AND Rule (Multiply along branches): To find the probability of a sequence of events occurring one after the other (e.g., picking a Red counter AND then a Blue counter), you multiply the probabilities along the corresponding path.
- The OR Rule (Add the paths): To find the probability of one outcome OR another, you add their individual probabilities together. For example, P(getting one of each colour) = P(Red then Blue) + P(Blue then Red).
A critical distinction is whether an event is 'with replacement' or 'without replacement'. If an item is not replaced, the total number of outcomes (the denominator) and potentially the number of favourable outcomes (the numerator) will decrease for the second event. This is a common area where candidates lose marks.
Concept 3: Venn Diagrams & Set Notation
Venn diagrams are used to visualise the relationships between different sets of data. In probability, they are excellent for solving problems involving overlapping categories.
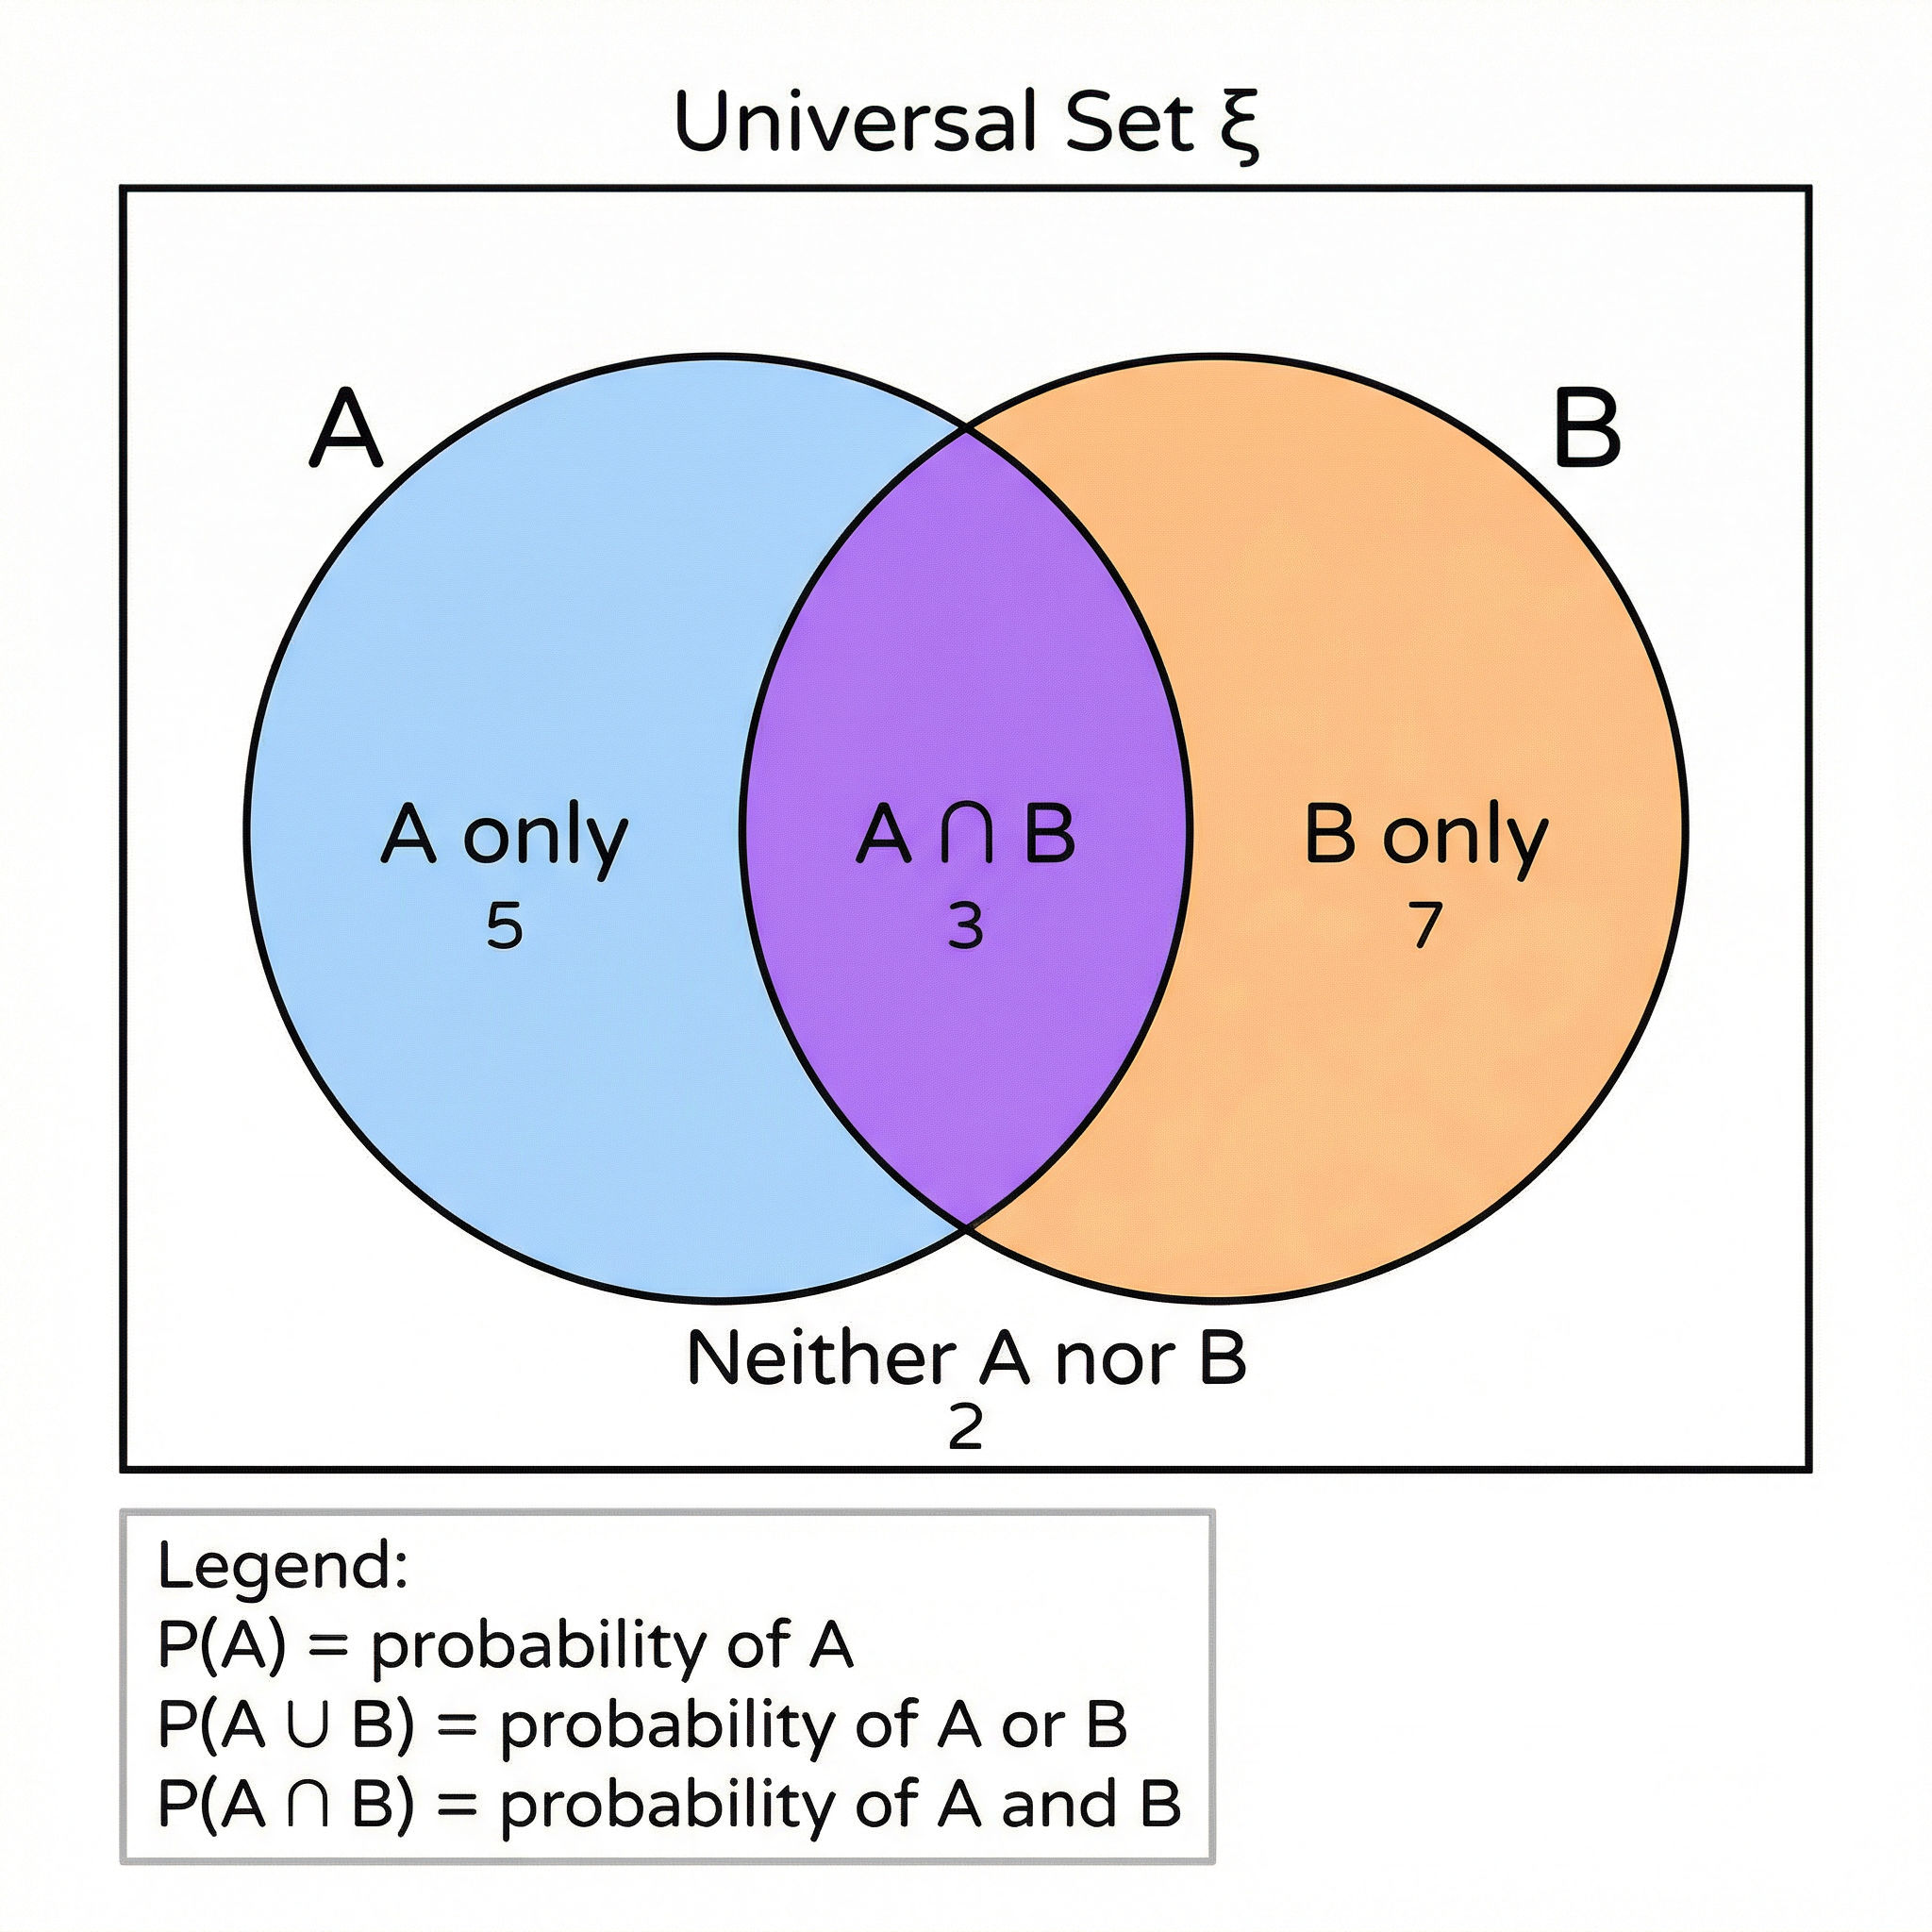
Key notation you must be familiar with:
- ξ: The universal set (everything inside the rectangle).
- A ∪ B: The union of A and B (everything in A OR B or both).
- A ∩ B: The intersection of A and B (only the things in BOTH A and B).
- A': The complement of A (everything not in A).
To calculate probabilities from a Venn diagram, you divide the number in the region of interest by the total number of items in the universal set. For example, P(A ∩ B) = (Number in intersection) / (Total in ξ).
Concept 4: Conditional Probability (Higher Tier)
Conditional probability deals with situations where the probability of an event is dependent on the outcome of a previous event. The key phrase is "given that". For example, "what is the probability of a student studying Physics, given that they study Maths?".
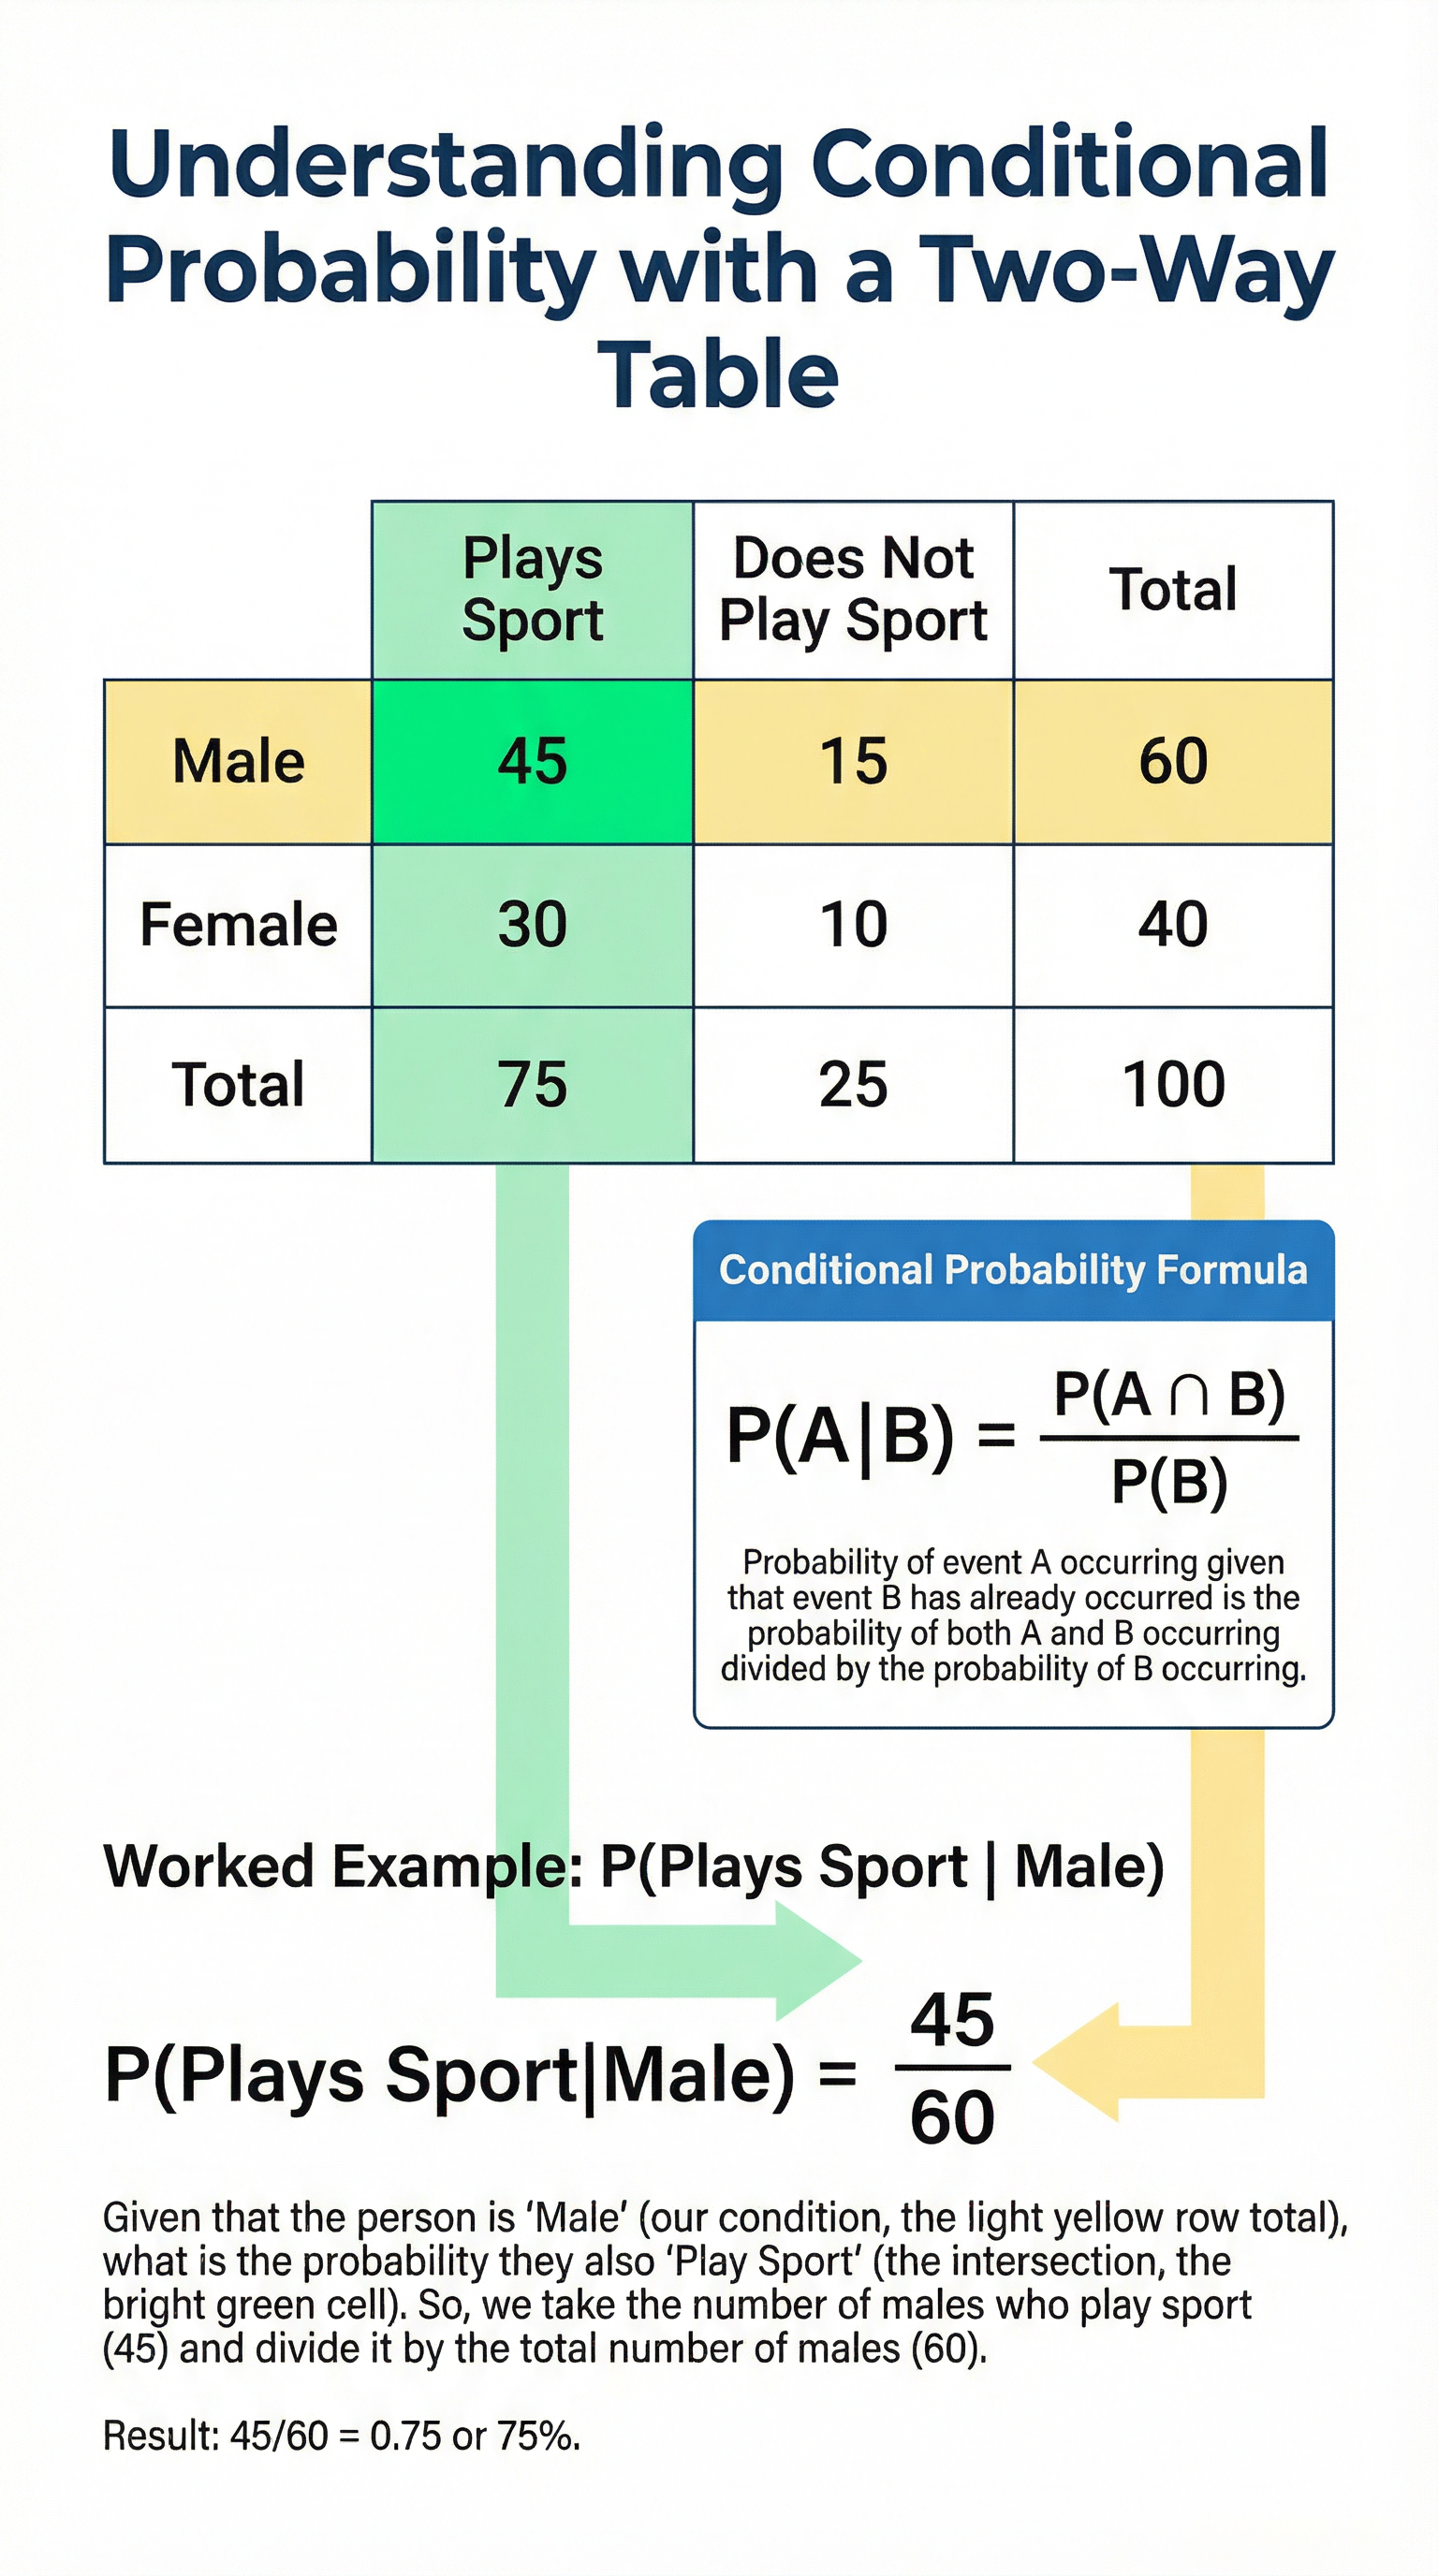
The formula for conditional probability is:
**P(A|B) = P(A ∩ B) / P(B)**This reads as "the probability of A given B is the probability of A and B, divided by the probability of B". In essence, you are reducing your 'world' of possibilities to only the outcomes where B has occurred. On a Venn diagram, this means your denominator is no longer the total of the universal set, but the total of the set that is the condition.
Mathematical/Scientific Relationships
- Probability Sum: For any set of mutually exclusive and exhaustive events, the probabilities must sum to 1.
- The AND Rule: P(A and B) = P(A) × P(B) for independent events.
- The OR Rule: P(A or B) = P(A) + P(B) for mutually exclusive events.
- General Addition Rule: P(A ∪ B) = P(A) + P(B) - P(A ∩ B). This is crucial for non-mutually exclusive events to avoid double-counting the intersection. (Must memorise)
- Conditional Probability Formula: P(A|B) = P(A ∩ B) / P(B). (Given on formula sheet for Higher Tier)
Practical Applications
Probability is not just an abstract concept; it underpins many real-world industries. Meteorologists use complex probabilistic models to forecast the weather, assessing the likelihood of rain based on atmospheric conditions. The insurance industry is built entirely on probability, calculating the risk of events like car accidents or house fires to determine premiums. In medicine, clinical trials use probability to determine if a new drug is effective, comparing the outcomes of a treatment group to a control group. Even in technology, the spam filter in your email uses probability to assess whether an incoming message is junk based on the words it contains.