
Study Notes
Overview
Probability is a fundamental area of mathematics that quantifies uncertainty. For your WJEC GCSE exam, it represents a significant and predictable portion of the paper, typically featuring questions worth between 4 and 6 marks. This topic is not just about flipping coins; it is the foundation for understanding risk, making predictions from data, and interpreting statistics in the real world. Examiners are looking for candidates who can move beyond simple calculations and apply their knowledge to structured problems, often involving multiple steps or conditions. You will be expected to construct and interpret tree diagrams and Venn diagrams, understand the crucial difference between independent and dependent events, and use correct mathematical notation throughout. Strong performance in probability questions demonstrates clear logical thinking and is essential for achieving a high grade in both Foundation and Higher tiers.
Key Concepts
Concept 1: The Probability Scale
Probability is always measured on a scale from 0 to 1. An event with a probability of 0 is impossible, while an event with a probability of 1 is certain. An event with a probability of 0.5 has an even chance of occurring. It is crucial to express your answers as a fraction, decimal, or percentage. Examiners will not award marks for answers given as ratios (e.g., 1:4) or in words (e.g., '1 in 5').
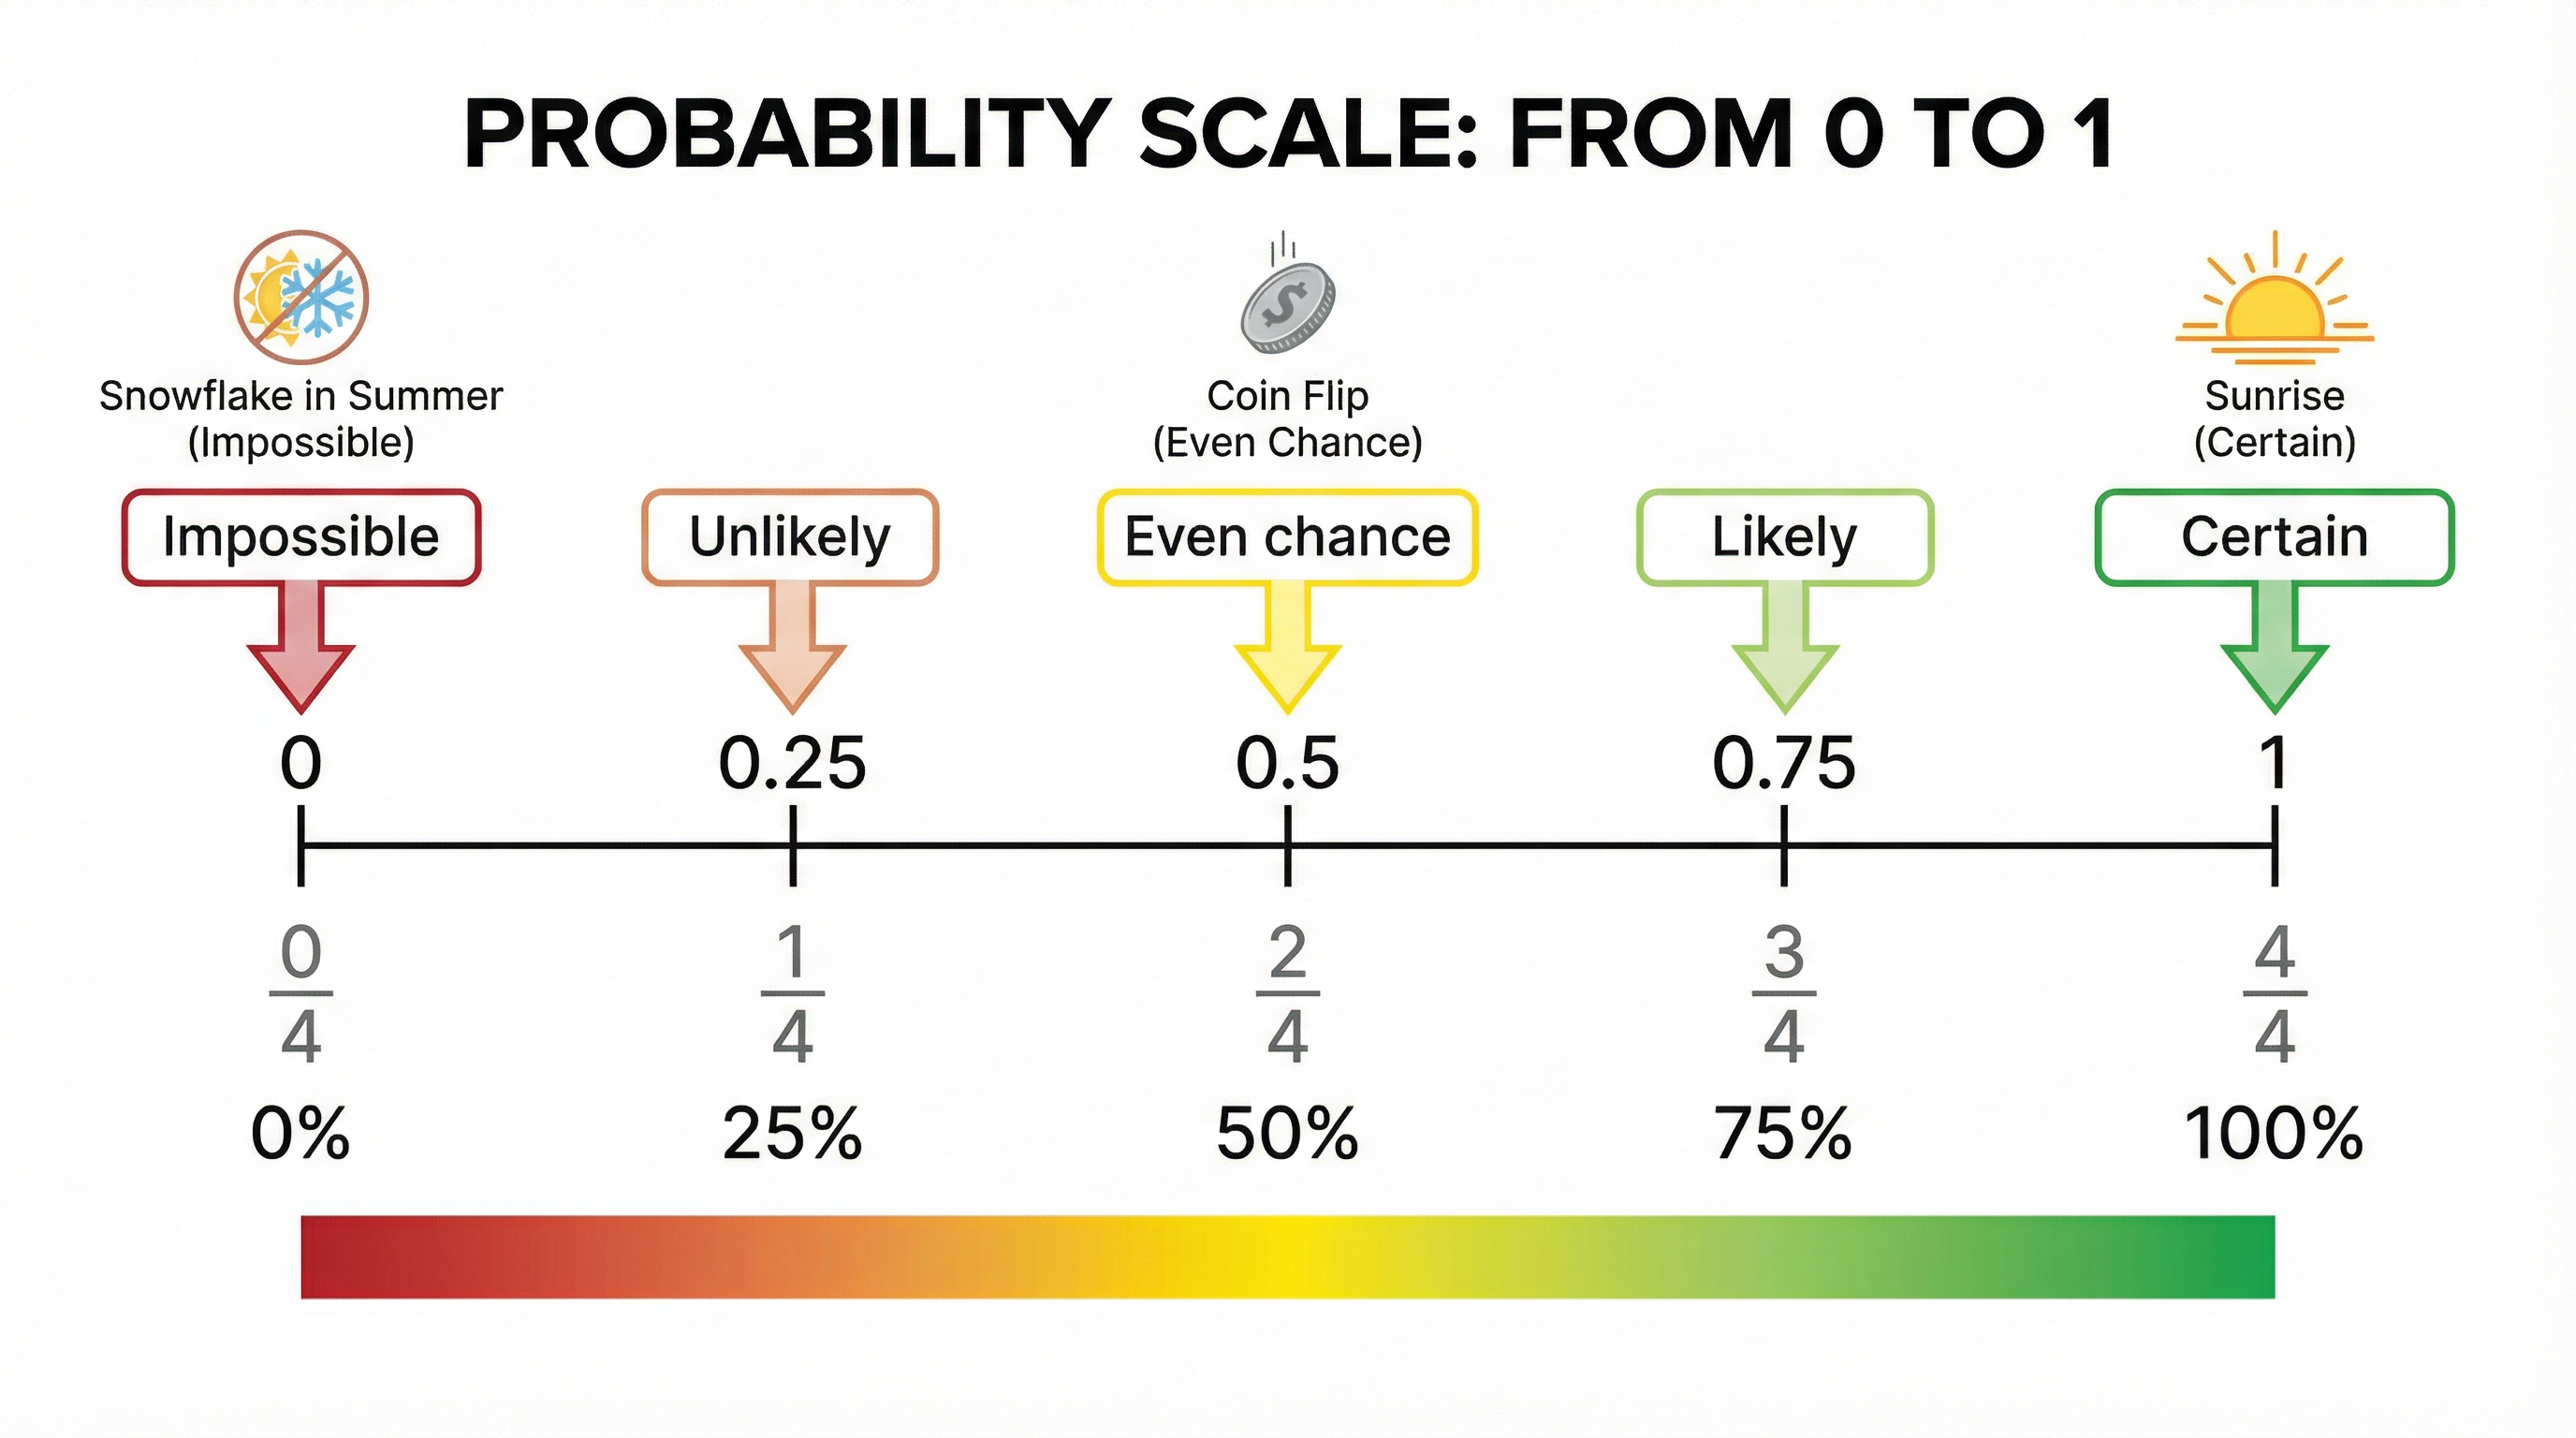
Example: The probability of rolling a 7 on a standard six-sided die is 0, because it is impossible. The probability of rolling a number less than 7 is 1, because it is certain.
Concept 2: Calculating Single Event Probability
The core formula that you must memorise is:
**P(Event) = (Number of Favourable Outcomes) / (Total Number of Possible Outcomes)**This formula is the bedrock of all probability calculations. A common first mark in an exam question is for correctly identifying the denominator (the total number of possible outcomes).
Example: A bag contains 5 red balls, 3 blue balls, and 2 green balls. The total number of possible outcomes is 5 + 3 + 2 = 10. The probability of picking a blue ball is P(Blue) = 3/10.
Concept 3: Combined Events - The 'AND' and 'OR' Rules
This is where probability gets more complex and where many students make mistakes. You need to understand two key rules:
- The 'AND' Rule (Multiplication): When you need to find the probability of two or more events all happening, you multiply their individual probabilities. This is used for successive events, like flipping a coin AND rolling a die.
- The 'OR' Rule (Addition): When you need to find the probability of one event or another event happening (and they are mutually exclusive), you add their probabilities.
Example ('AND'): The probability of flipping a coin and getting heads (P(H) = 1/2) AND rolling a die and getting a 6 (P(6) = 1/6) is P(H and 6) = 1/2 * 1/6 = 1/12.
Example ('OR'): The probability of rolling a 5 (P(5) = 1/6) OR a 6 (P(6) = 1/6) is P(5 or 6) = 1/6 + 1/6 = 2/6 = 1/3.
Concept 4: Tree Diagrams (Independent and Dependent Events)
Tree diagrams are a vital tool for visualising combined events, and WJEC examiners love them. They are particularly useful for distinguishing between:
- Independent Events: The outcome of the first event does not affect the outcome of the second. Example: Rolling a die twice.
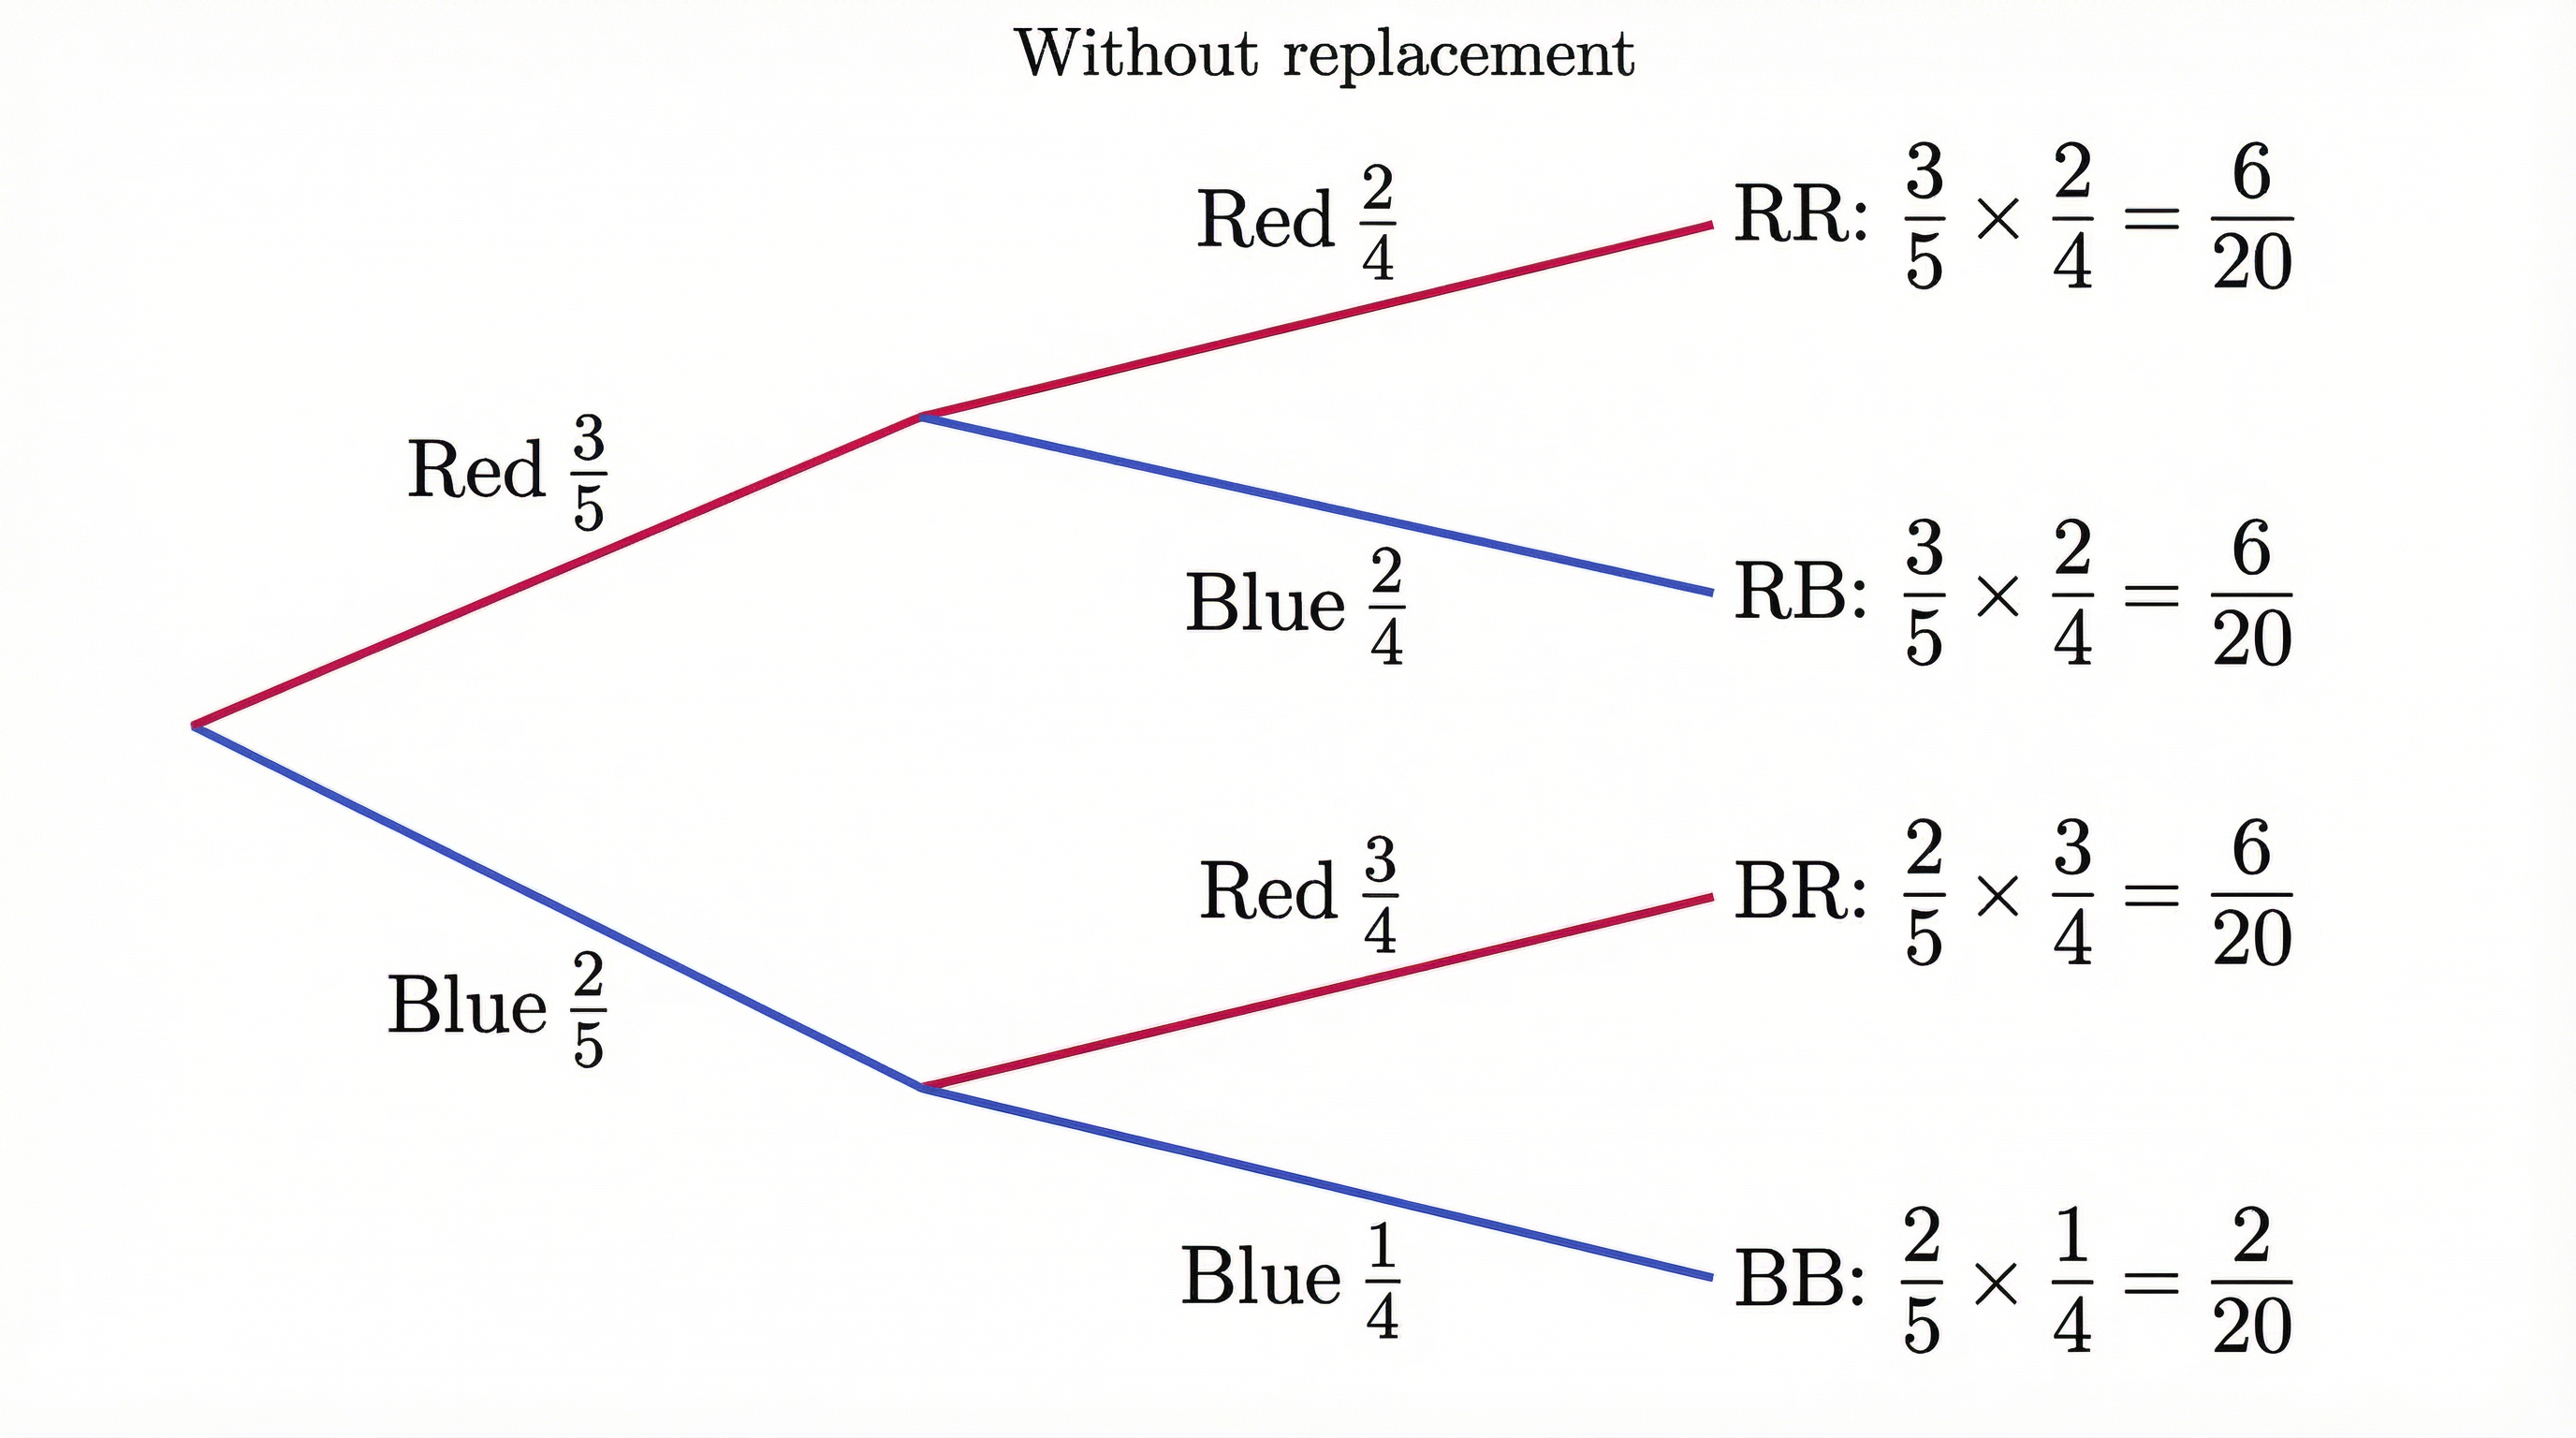
- Dependent Events: The outcome of the first event does affect the outcome of the second. This is the classic 'without replacement' scenario.
When drawing a tree diagram, remember these two rules to secure method marks:
- The probabilities on the branches from a single point must sum to 1.
- To find the probability of a final outcome, you multiply the probabilities along the branches leading to it.
Concept 5: Venn Diagrams (Higher Tier)
Venn diagrams are used to represent the relationship between different sets of data. In probability, they are excellent for solving questions involving overlapping categories.
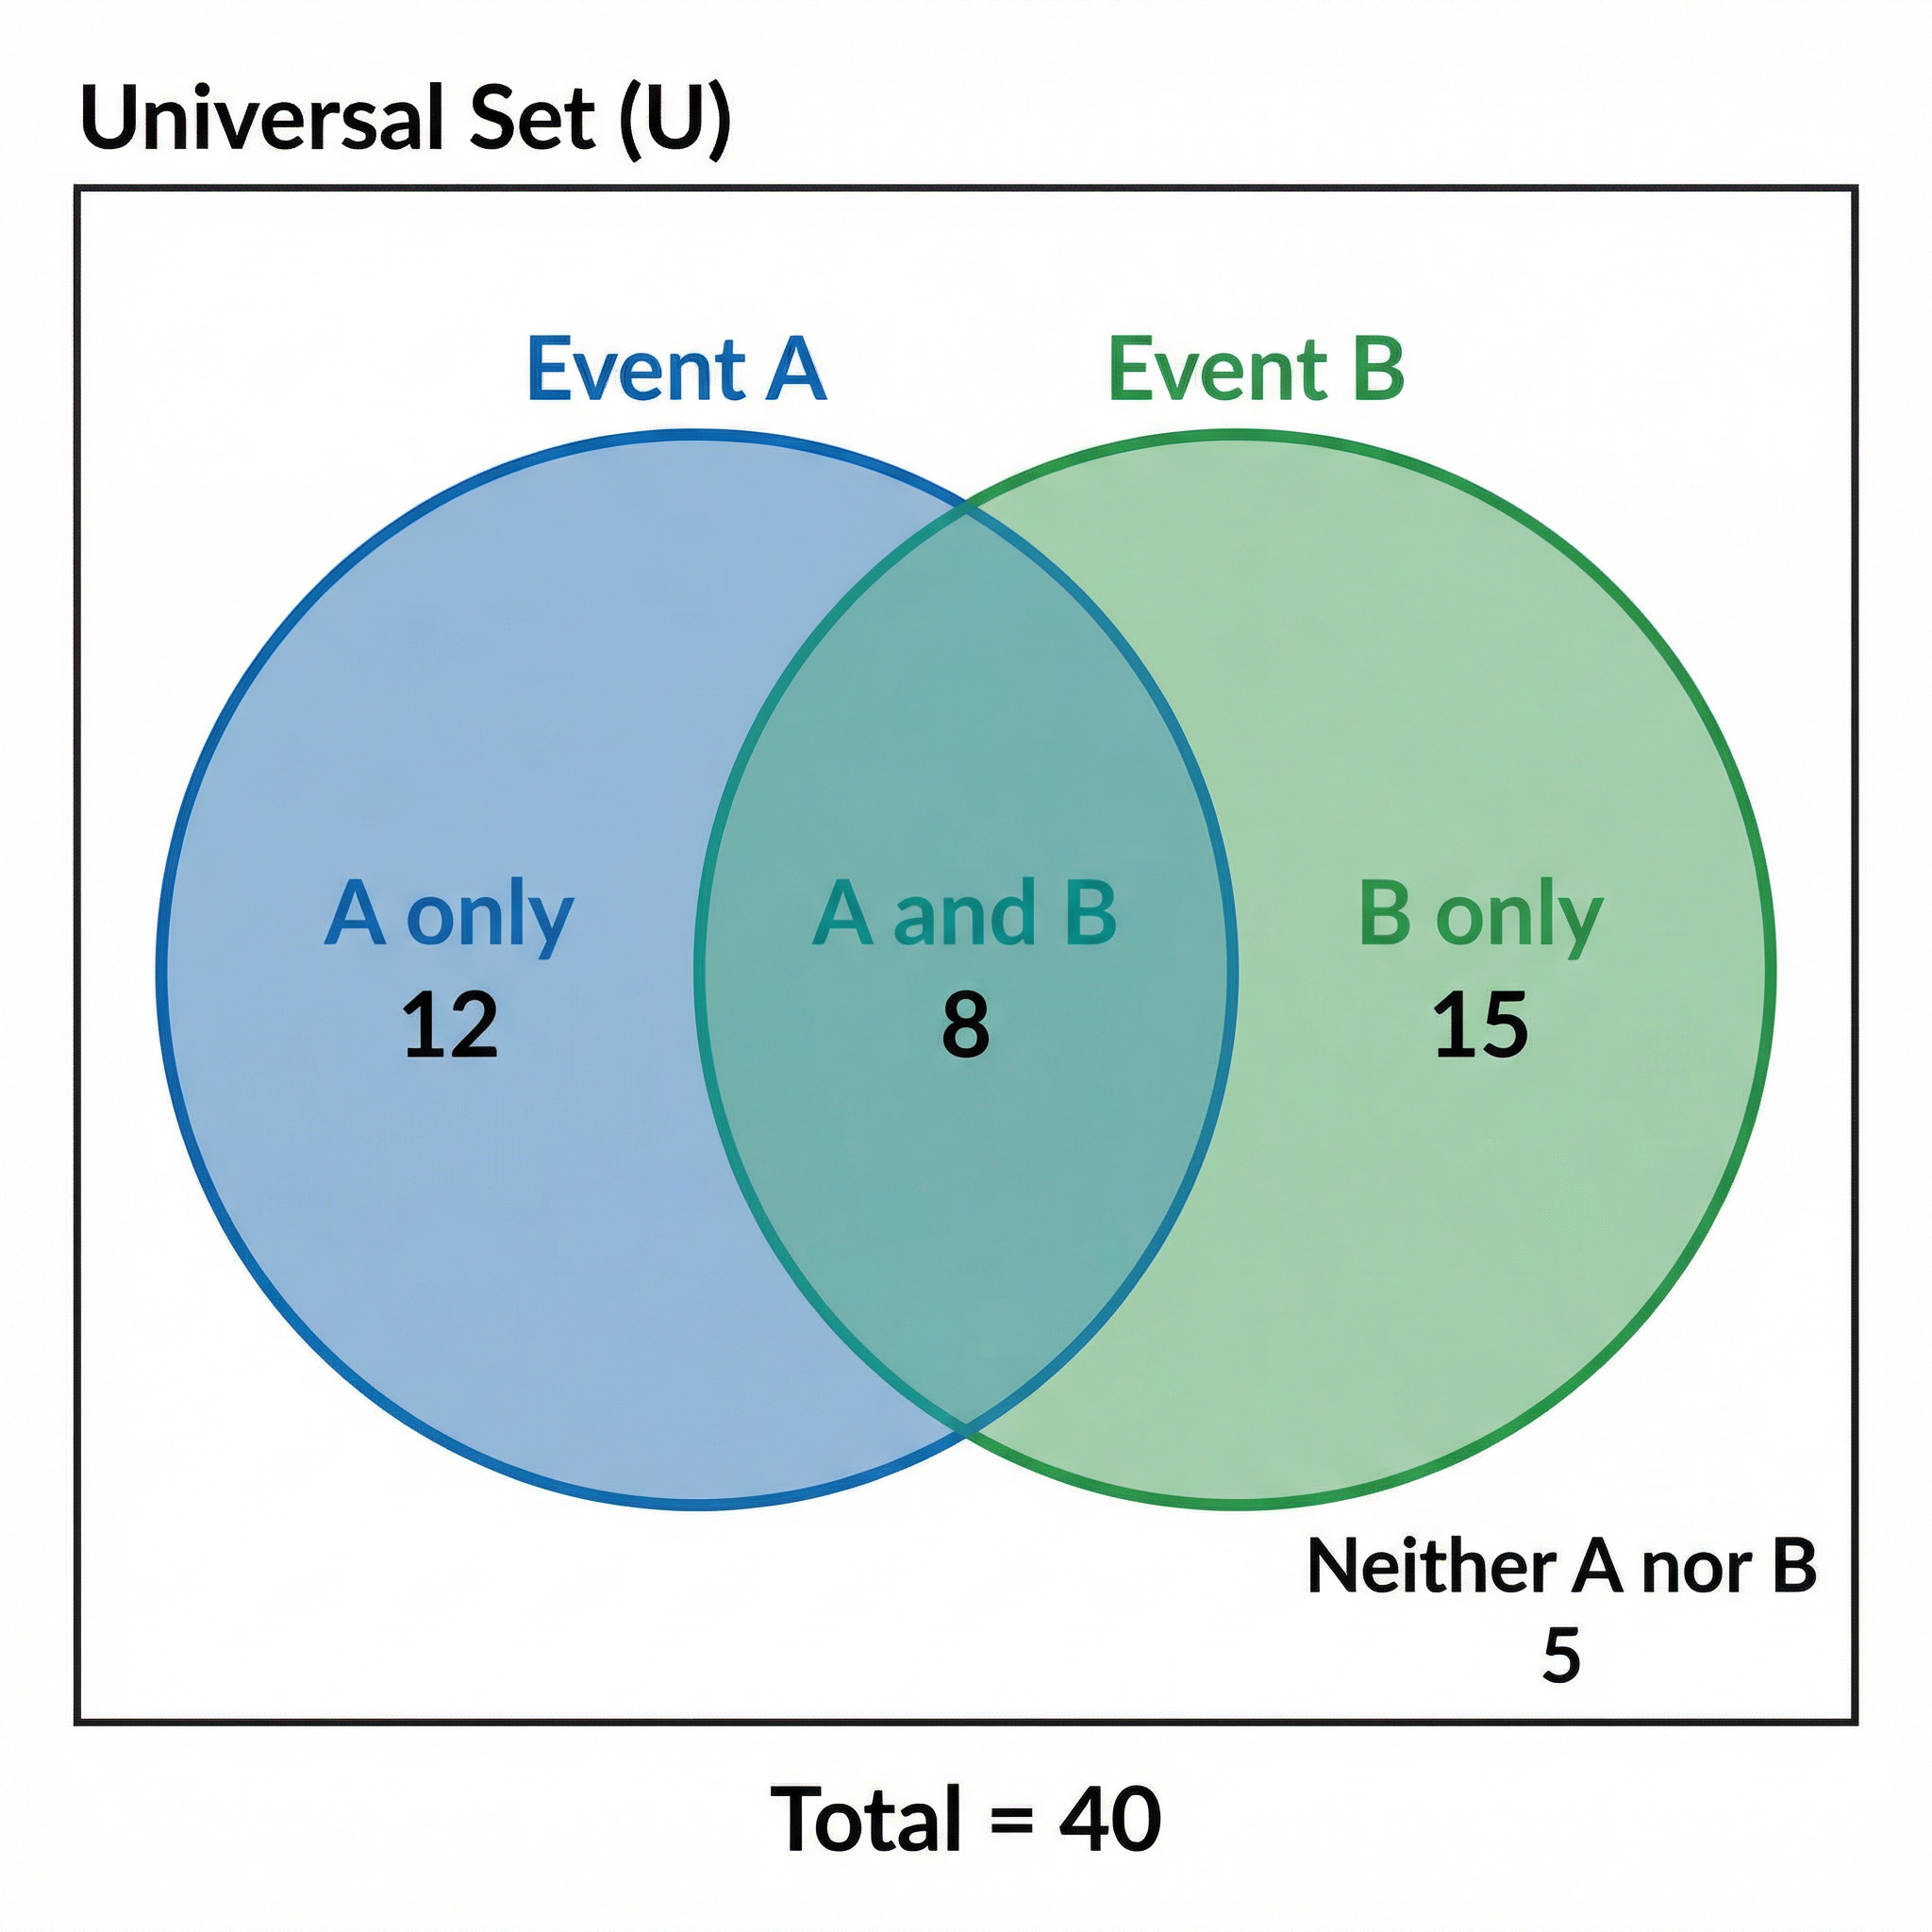
Example: In a group of 40 students, 25 study History (H) and 18 study Geography (G). If 10 study both, a Venn diagram can help find P(H only) or P(neither H nor G).
Mathematical/Scientific Relationships
- Basic Probability Formula: P(A) = Favourable Outcomes / Total Outcomes. (Must memorise)
- Complementary Events: P(not A) = 1 - P(A). This is extremely useful for 'at least one' questions. (Must memorise)
- Multiplication Rule (Independent Events): P(A and B) = P(A) * P(B). (Must memorise)
- Addition Rule (Mutually Exclusive Events): P(A or B) = P(A) + P(B). (Must memorise)
- Conditional Probability (Higher Tier): P(B|A) = P(A and B) / P(A). This formula is given on some formula sheets but is better understood through tree diagrams. It represents the probability of B happening, given that A has already happened.
Practical Applications
Probability is not just an abstract concept; it is used everywhere:
- Insurance: Companies use probability to calculate the likelihood of events like car accidents or house fires to determine insurance premiums.
- Medicine: Probability is used to assess the effectiveness of new drugs and the risk of side effects.
- Weather Forecasting: Meteorologists use complex probability models to predict the chance of rain.
- Gaming: The odds in games of chance, from slot machines to card games, are all based on probability.