Study Notes

Overview
Flame emission spectroscopy is a powerful analytical technique used to identify the elements present in a sample and determine their concentration. It is a cornerstone of instrumental analysis in chemistry, offering significant advantages over traditional qualitative methods like manual flame tests. For your WJEC GCSE Chemistry exam, a thorough understanding of this topic is crucial, as it is frequently assessed in questions that test your knowledge of both the underlying principles and the practical applications of the technique. You will be expected to not only describe the process but also to explain why it is so effective and how to interpret the data it produces. This topic connects to fundamental concepts of atomic structure, electron energy levels, and the nature of light, providing a synoptic link to other areas of your chemistry course. Exam questions often involve interpreting line spectra, comparing the method to flame tests, and explaining the advantages of using instrumental methods in industrial and environmental contexts.
Key Concepts
Concept 1: The Principle of Flame Emission Spectroscopy
At its core, flame emission spectroscopy is based on a simple principle: when atoms are heated to high temperatures, they emit light. The colour and characteristics of this light are unique to each element, acting as a chemical 'fingerprint'. The process involves several key steps:
-
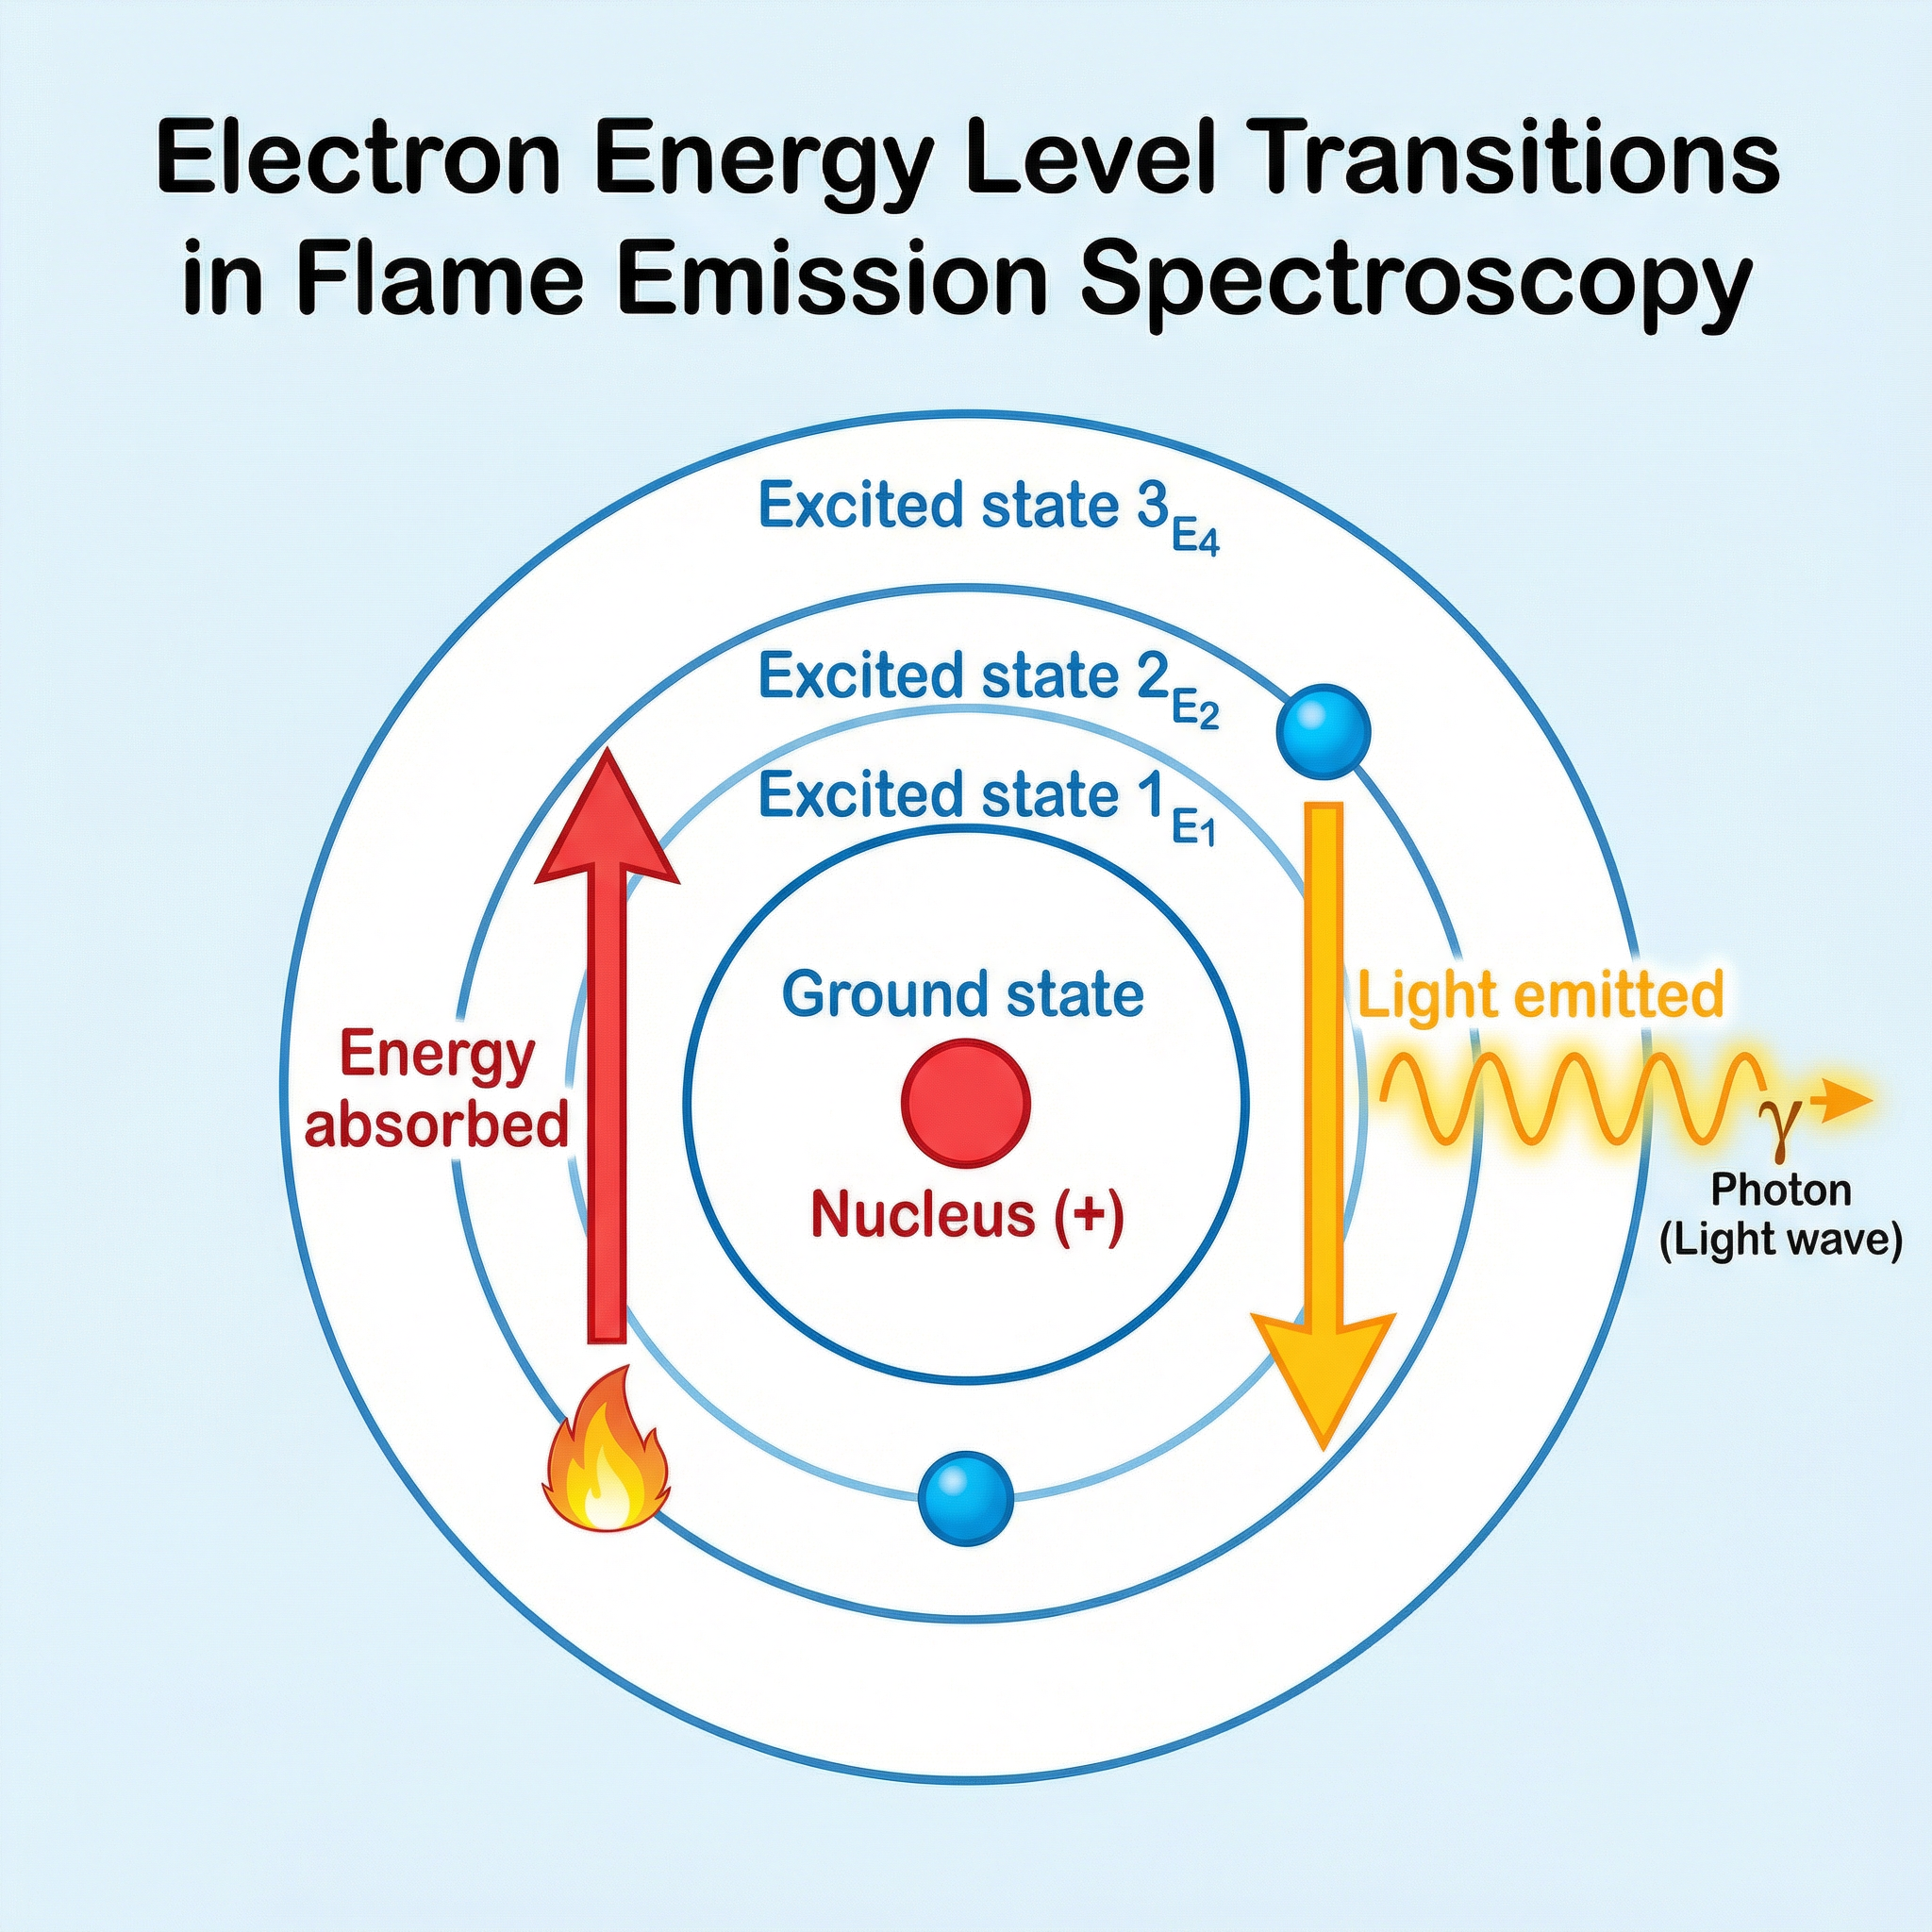
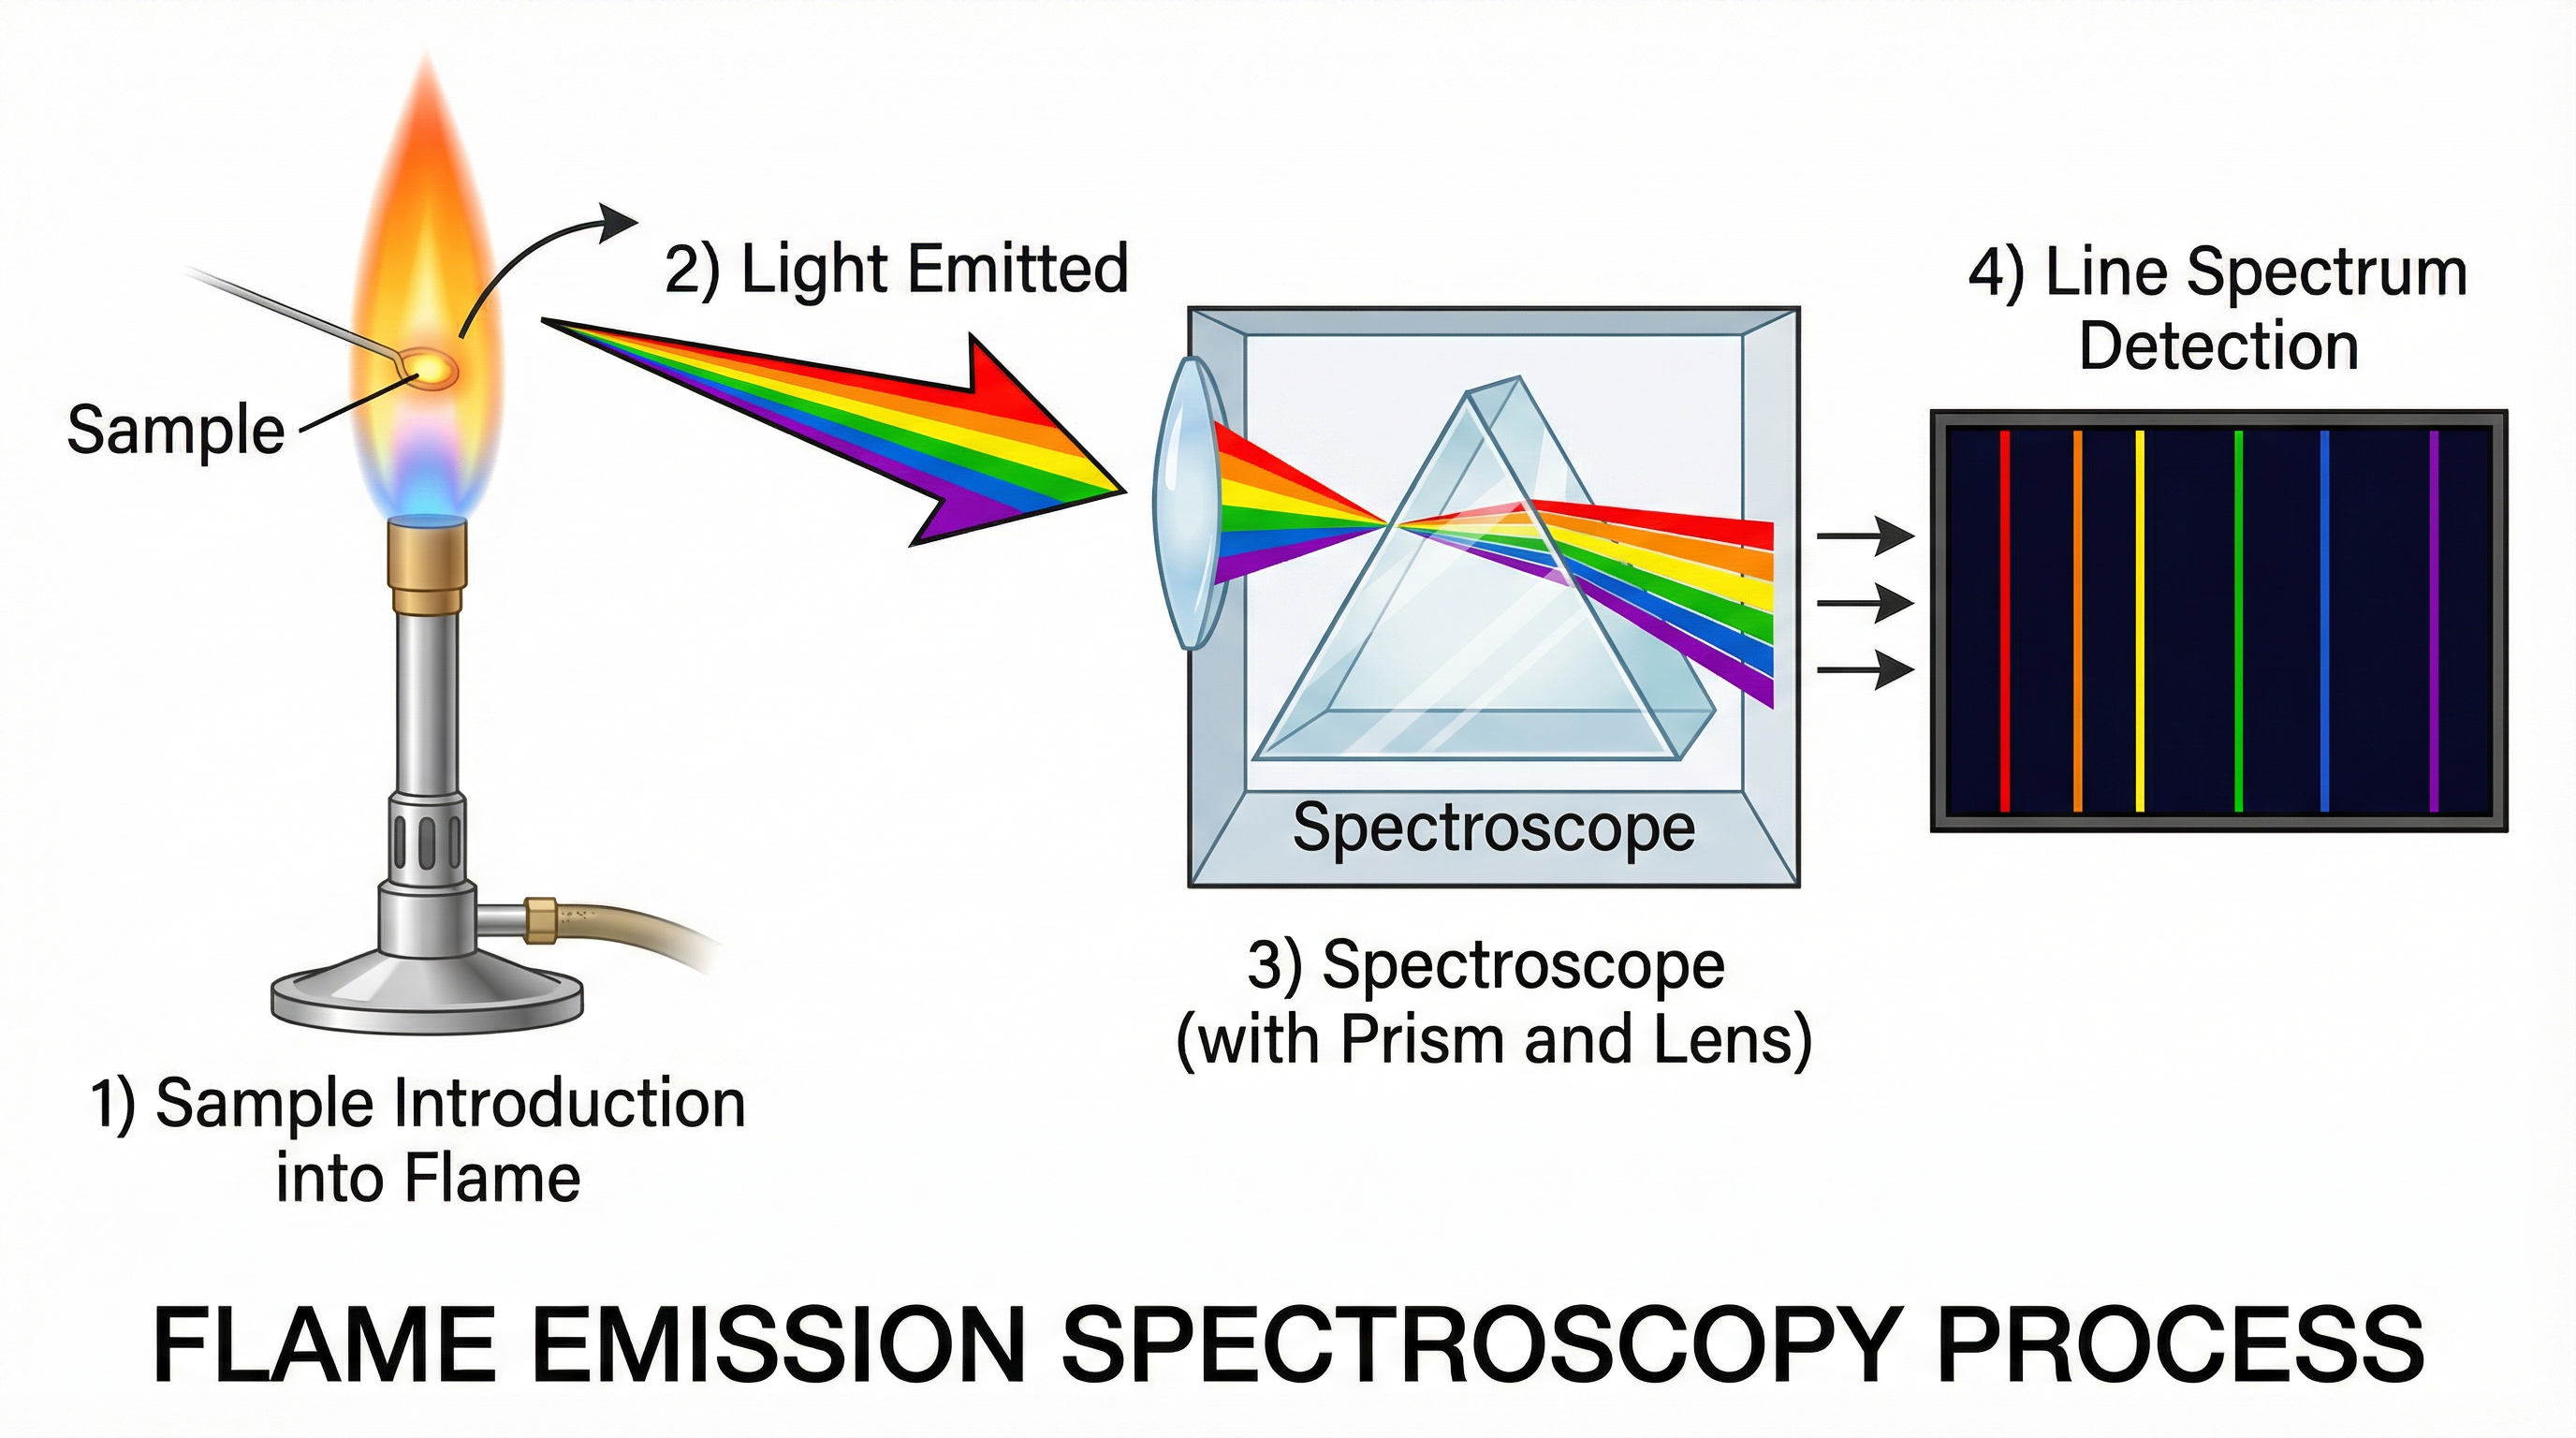
Atomisation and Excitation: A sample, typically in liquid form, is introduced into a hot flame (e.g., from a Bunsen burner or a plasma torch). The intense heat first evaporates the solvent and then breaks down the sample into individual gaseous atoms. The heat then provides the energy to excite the electrons within these atoms.
-
Electron Transitions (Higher Tier): Electrons in an atom occupy specific energy levels or shells. When heated, they absorb energy and 'jump' to higher, unstable energy levels. This is the 'excitation' step. However, they cannot stay in this excited state for long. They quickly fall back to their original, more stable energy level (the 'ground state'). As they fall, they release the absorbed energy in the form of light. Because electrons can only exist in specific energy levels, they emit light of very specific energies, and therefore specific wavelengths and colours.
-
Emission and Detection: The emitted light is then passed through a spectroscope. This device separates the light into its constituent wavelengths, producing a line spectrum. Each line in the spectrum corresponds to a specific electron transition and is characteristic of a particular element. A detector, such as a CCD (charge-coupled device), measures the position and intensity of these spectral lines.
Concept 2: Qualitative vs. Quantitative Analysis
Flame emission spectroscopy can be used for two types of analysis:
-
Qualitative Analysis (Identifying the element): The position of the lines in the spectrum is unique to each element. By comparing the line spectrum of an unknown sample to a database of known spectra, we can identify which elements are present. If the lines of the unknown sample match the lines of a known element (e.g., sodium), then that element is present in the sample.
-
Quantitative Analysis (Determining the concentration): The intensity (brightness) of the spectral lines is directly proportional to the concentration of the element in the sample. A more concentrated sample will produce brighter lines because there are more atoms emitting light. To determine the exact concentration, a calibration curve is created by measuring the line intensity of several standard solutions of known concentrations. The intensity of the unknown sample is then measured, and its concentration is determined by reading off the calibration curve.
Mathematical/Scientific Relationships
Calibration Curve
A key part of quantitative analysis is the use of a calibration curve. This is a graph plotting the intensity of a spectral line against the concentration of the element in a set of standard solutions.
- X-axis: Concentration (e.g., in ppm or mg/L)
- Y-axis: Intensity (arbitrary units)
The graph is typically a straight line that passes through the origin, showing a direct proportionality between concentration and intensity. To find the concentration of an unknown sample, you measure its intensity and find the corresponding concentration on the x-axis.
Practical Applications
Flame emission spectroscopy is used in a wide range of fields:
- Environmental Monitoring: To measure the concentration of heavy metals (e.g., lead, mercury) in water supplies.
- Clinical Chemistry: To measure the concentration of ions like sodium (Na+), potassium (K+), and lithium (Li+) in blood plasma. This is vital for diagnosing and monitoring various medical conditions.
- Food Industry: To ensure that the mineral content of foods is at the correct level and to check for contamination.
- Forensic Science: To analyse samples from crime scenes for the presence of specific elements.