Distance-time graphs

    OCR
    GCSE
    Physics

    Master the art of interpreting distance-time graphs for your OCR GCSE Physics exam. This guide breaks down how to calculate speed from gradients, analyse motion, and tackle tricky exam questions for both Foundation and Higher tiers, ensuring you can secure every available mark.

    5
    Min Read
    3
    Examples
    5
    Questions
    7
    Key Terms
    🎙 Podcast Episode
    Distance-time graphs
    8:30
    0:00-8:30

    Study Notes

    An illustration showing the key concepts of distance-time graphs.

    Overview

    Distance-time graphs are a fundamental tool in physics for visually representing an object's journey. For your OCR GCSE exam, they are a gift of marks if you understand the core principles. This topic, specification reference 1.6, is all about the relationship between distance, time, and speed. A significant portion of your exam (60% AO2) is focused on applying your knowledge, and these graphs are a prime testing ground for that skill. You will be expected to interpret the shape of the graph to describe motion and perform calculations to determine speed. Higher tier candidates will also need to demonstrate the ability to find instantaneous speed from a curve by drawing a tangent. This guide will equip you with the techniques to confidently analyse any distance-time graph an examiner throws at you.

    Listen to our podcast guide on Distance-Time Graphs.

    Key Concepts

    Concept 1: Interpreting the Gradient

    The single most important concept is that the gradient (steepness) of a distance-time graph represents the speed of the object. A steeper line means a faster speed, and a less steep line means a slower speed. This is because the gradient is calculated as the change in the y-axis (distance) divided by the change in the x-axis (time), which is the definition of speed.

    A visual guide to interpreting the shapes of distance-time graphs.

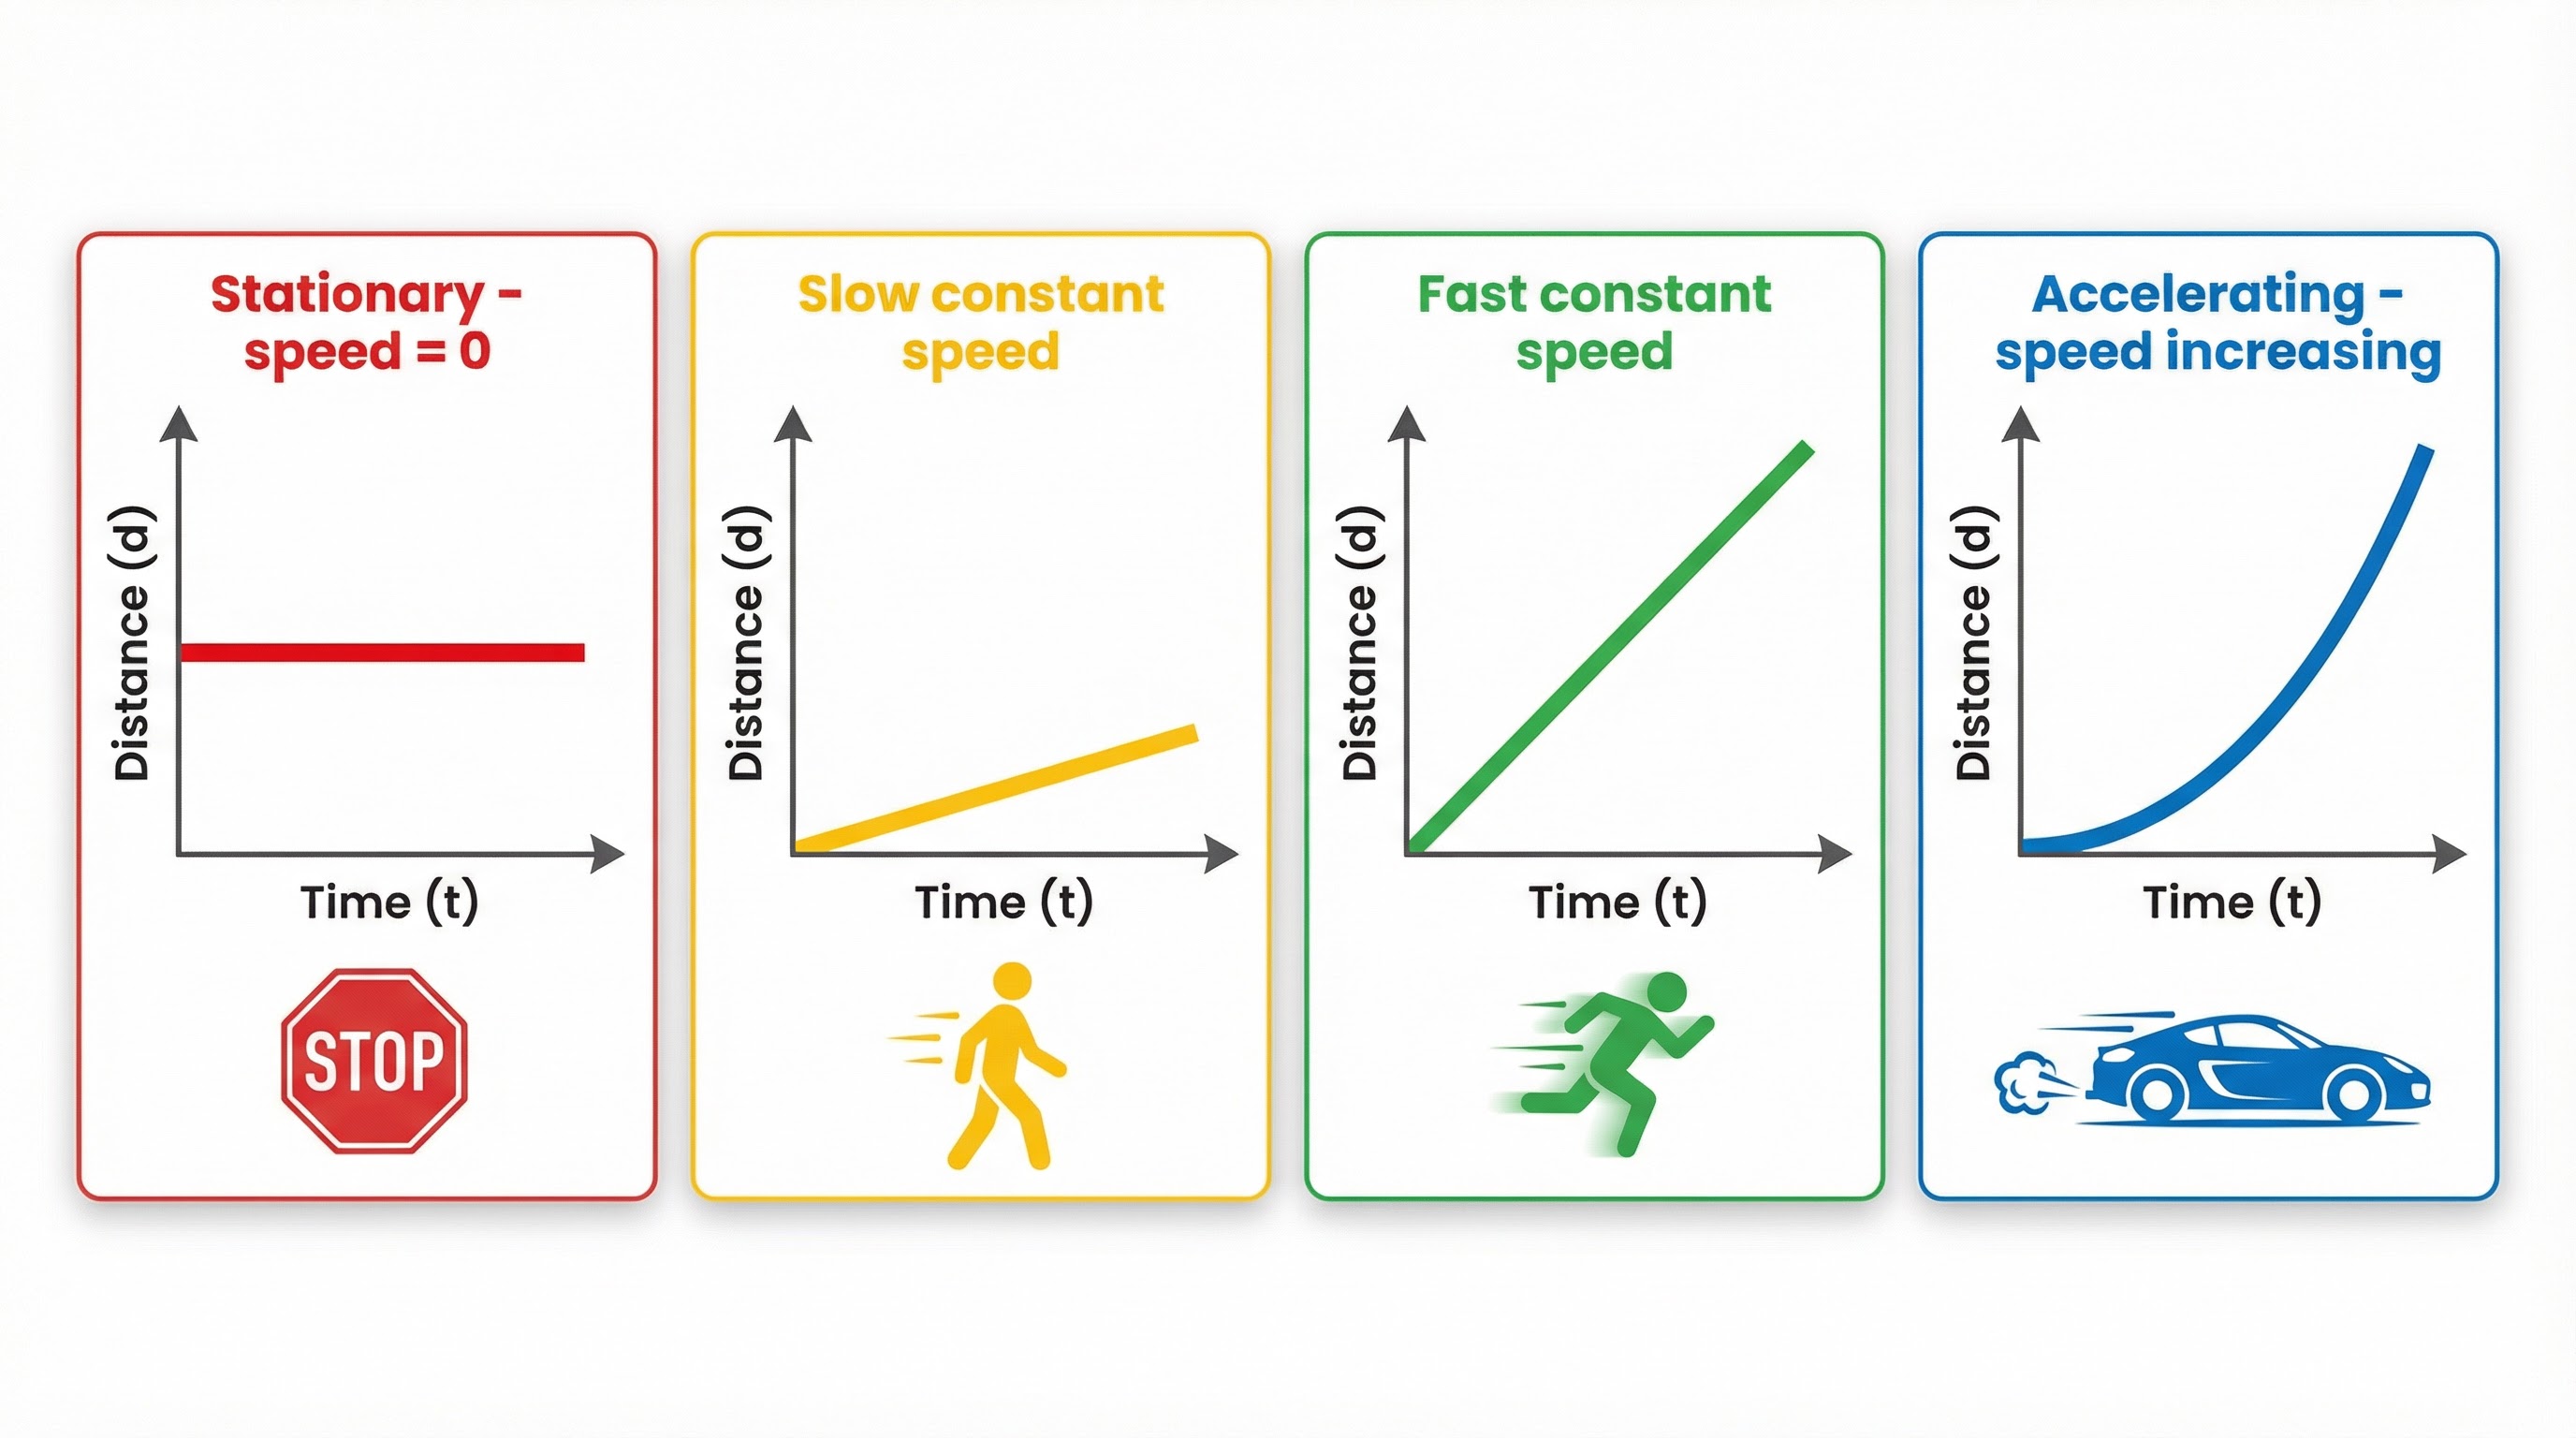
    • Horizontal Line: If the line is flat, the distance is not changing. The object is stationary. The gradient is zero, so the speed is 0 m/s. This is a common 1-mark question.
    • Straight, Diagonal Line: This shows the object is travelling at a constant speed. The gradient is constant, so the speed is unchanging.
    • Curved Line: A curve indicates that the speed is changing. This is acceleration (if the line gets steeper) or deceleration (if the line becomes less steep).

    Concept 2: Calculating Speed (Constant)

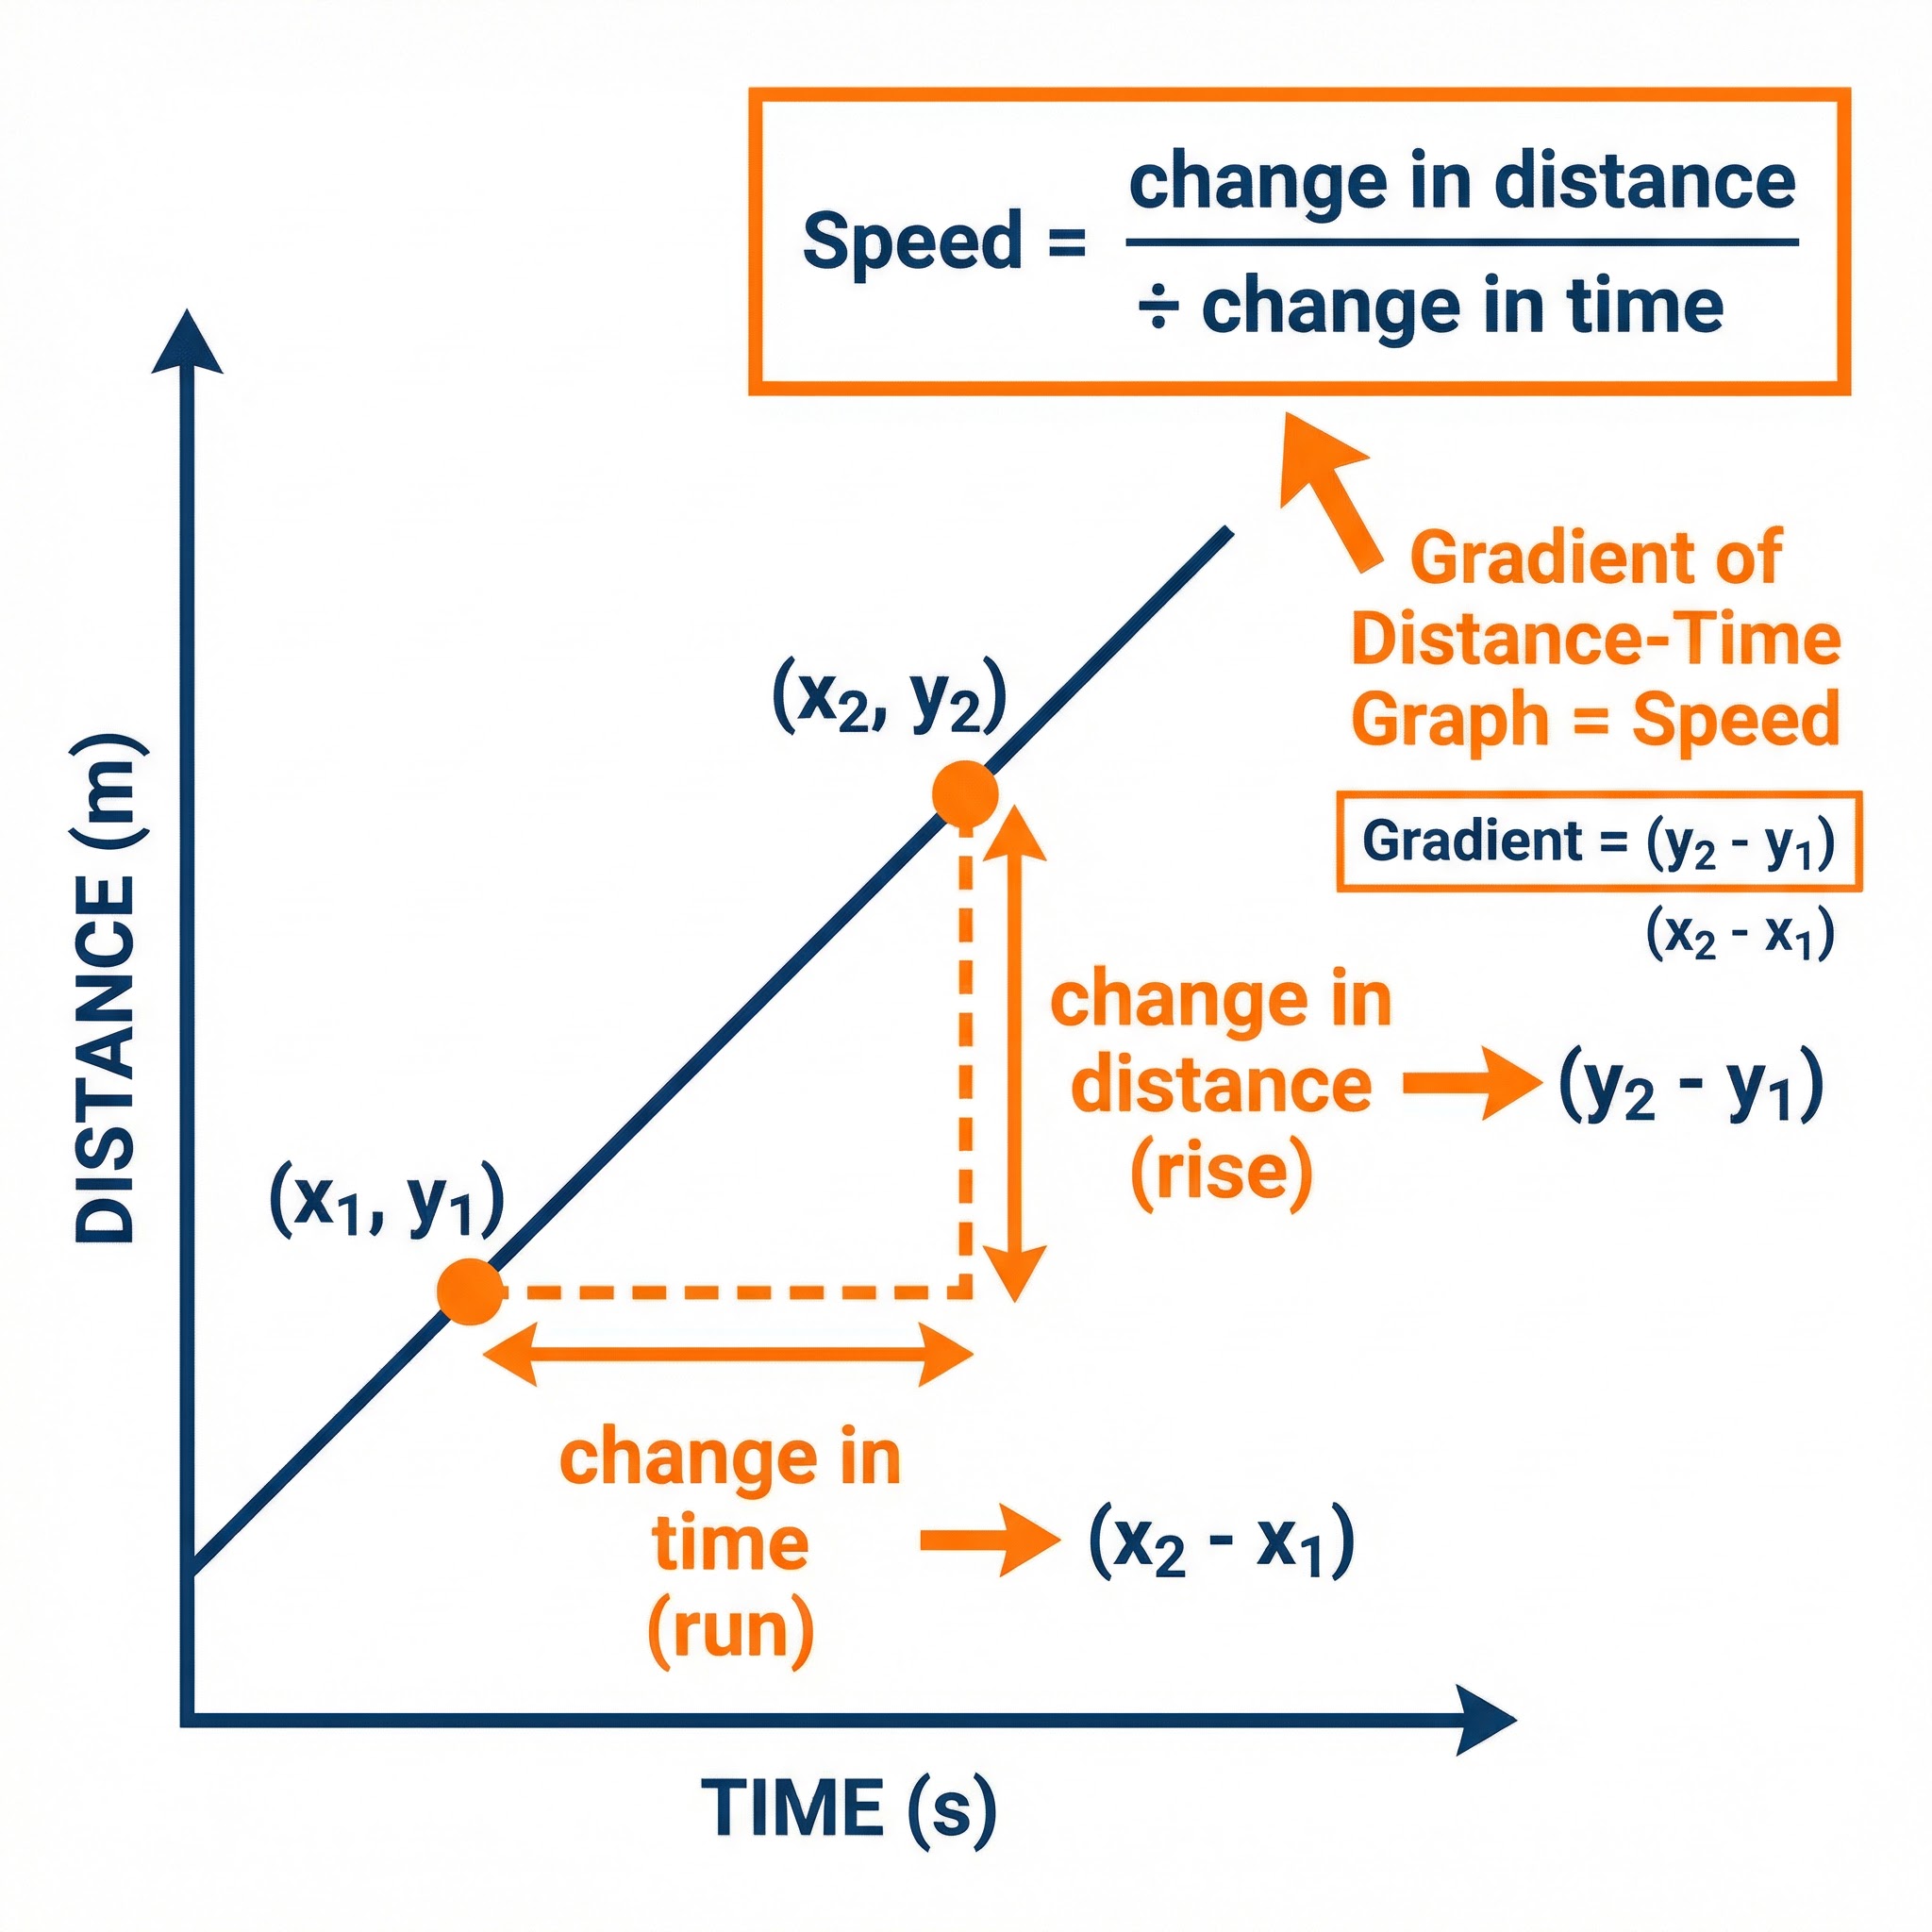
    For any straight-line section of the graph, you can calculate the constant speed using the formula:

    Speed = Gradient = Change in Distance / Change in TimeTo do this, you pick two points on the straight line, read their coordinates, and substitute them into the formula. It is crucial to select points as far apart as possible to minimise measurement errors and improve accuracy.

    Calculating speed using the gradient formula (rise over run).

    Example: A car travels from a distance of 20m to 80m in the time interval from 2s to 8s.

    • Change in Distance = 80m - 20m = 60m
    • Change in Time = 8s - 2s = 6s
    • Speed = 60m / 6s = 10 m/s

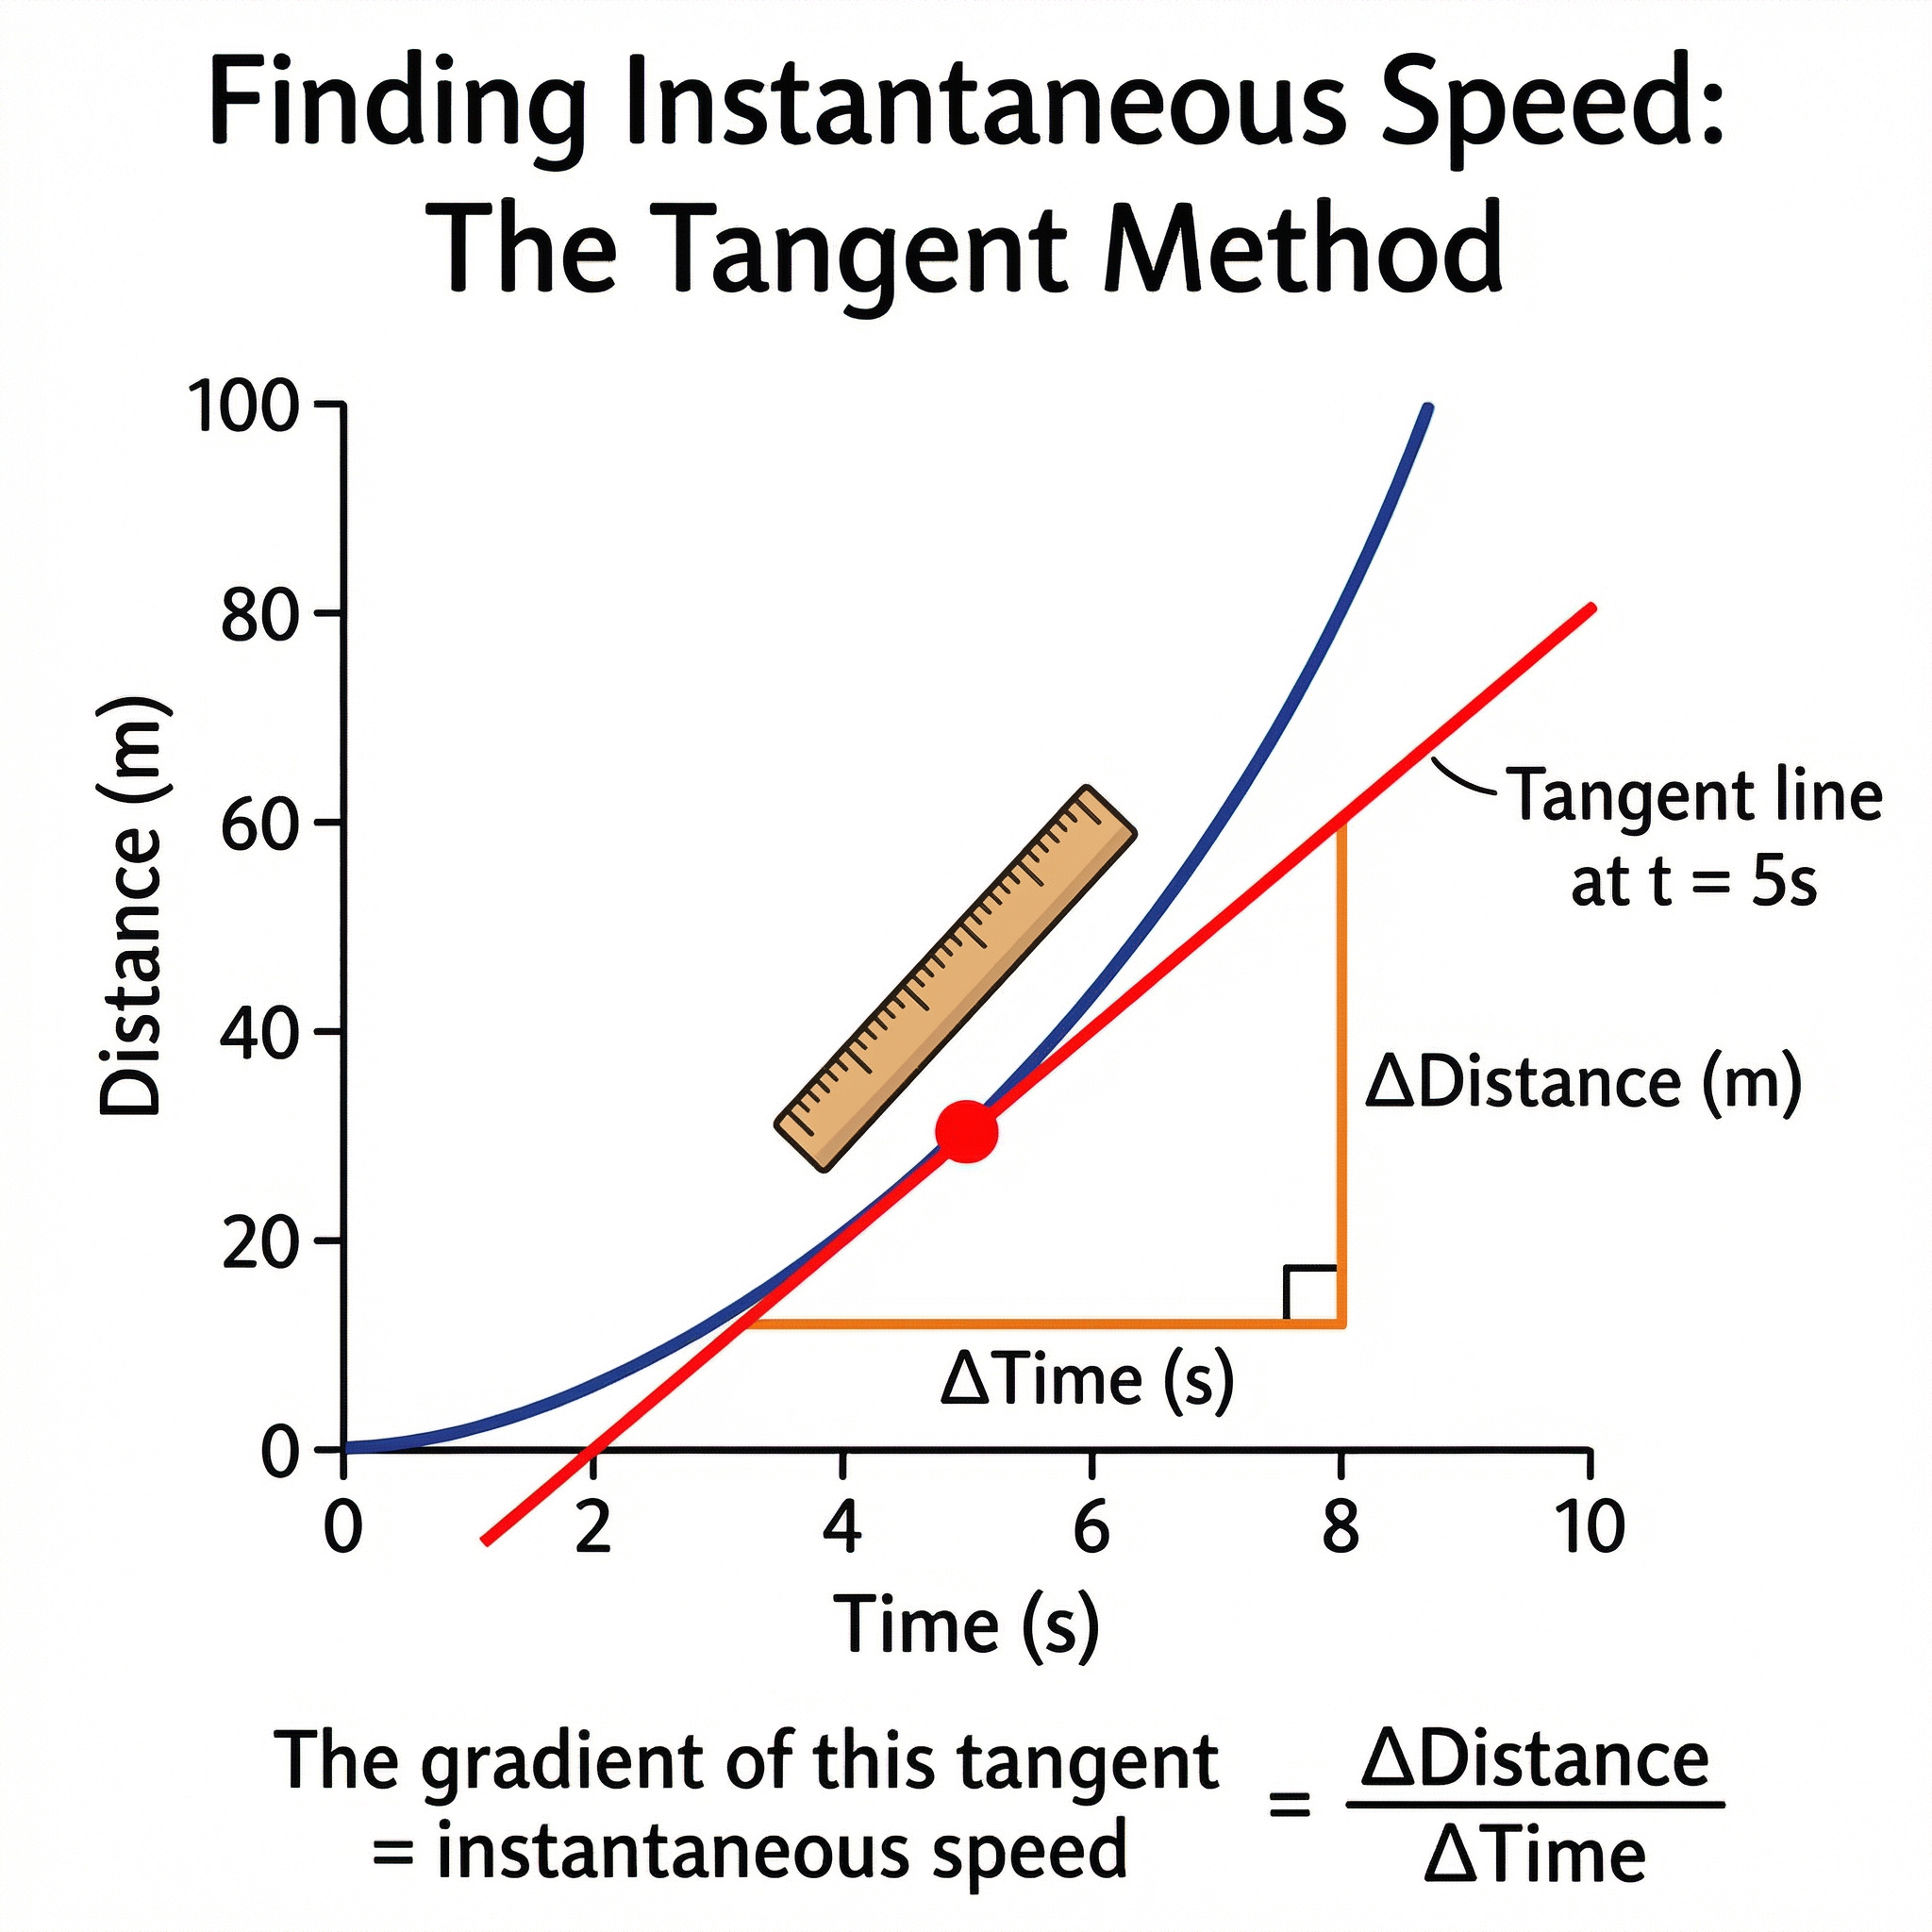
    Concept 3: Instantaneous Speed (Higher Tier Only)

    When an object is accelerating, its speed is different at every moment. To find the speed at a specific instant (e.g., at t=4s), you cannot simply use the formula above. You must find the instantaneous speed.

    To do this, you must draw a tangent to the curve at that specific point in time. A tangent is a straight line that just touches the curve at that one point without crossing it. Once you have accurately drawn the tangent with a ruler, you then calculate the gradient of that tangent. The gradient of the tangent is equal to the instantaneous speed at that point.

    The tangent method for finding instantaneous speed (Higher Tier).

    Mathematical/Scientific Relationships

    • Speed, Distance, Time Formula: Speed = Distance / Time. This is the fundamental relationship. It can be rearranged to find distance (Distance = Speed x Time) or time (Time = Distance / Speed). This formula is given on the formula sheet.
    • Gradient Formula: Gradient = (y2 - y1) / (x2 - x1). In the context of a distance-time graph, this becomes Speed = (change in distance) / (change in time). You must memorise how to apply this to the graph.

    Unit Conversions

    Examiners often try to catch students out with unit conversions. Be vigilant!

    • Time: If time is given in minutes, you must convert it to seconds to get speed in m/s. (1 minute = 60 seconds).
    • Distance: If distance is in kilometres (km), you may need to convert it to metres (m). (1 km = 1000 m).
    • Speed: To convert from km/h to m/s, you divide by 3.6. To convert from m/s to km/h, you multiply by 3.6. This is a useful shortcut but showing the full conversion is safer in an exam.

    Visual Resources

    3 diagrams and illustrations

    Calculating speed using the gradient formula (rise over run).
    Calculating speed using the gradient formula (rise over run).
    The tangent method for finding instantaneous speed (Higher Tier).
    The tangent method for finding instantaneous speed (Higher Tier).
    A visual guide to interpreting the shapes of distance-time graphs.
    A visual guide to interpreting the shapes of distance-time graphs.

    Interactive Diagrams

    2 interactive diagrams to visualise key concepts

    Diagram could not be rendered

    A flowchart to help you interpret the motion shown on any distance-time graph.

    Higher Tier OnlyCurved LineNeed speed at one point?Draw a TangentCalculate Gradient of TangentResult: Instantaneous Speed

    The process for finding instantaneous speed on a curved graph (Higher Tier).

    Worked Examples

    3 detailed examples with solutions and examiner commentary

    Practice Questions

    Test your understanding — click to reveal model answers

    Q1

    A runner's journey is shown on the graph. Calculate the runner's average speed for the entire journey.

    3 marks
    foundation

    Hint: Average speed is the total distance travelled divided by the total time taken.

    Q2

    Compare the motion of the object in section A (0-10s) with its motion in section C (30-50s).

    3 marks
    standard

    Hint: Compare means you need to state both similarities and differences. Use the gradients to compare the speeds.

    Q3

    The graph shows a car journey. For how long was the car stationary?

    1 marks
    foundation
    Q4

    Explain how you can tell from the graph that the object is accelerating between t=0s and t=10s.

    2 marks
    standard

    Hint: Think about what is happening to the gradient of the line.

    Q5

    (Higher Tier) A student has drawn a tangent to a curve at t=2s and calculated the instantaneous speed to be 15 m/s. The teacher states the actual speed is 12 m/s. Suggest two reasons why the student's measurement may be inaccurate.

    2 marks
    challenging

    Hint: Think about the two main sources of error in the tangent method.

    Key Terms

    Essential vocabulary to know

    More Physics Study Guides

    View all

    Refraction

    OCR
    GCSE

    This guide explains light refraction for OCR GCSE Physics (4.6), covering why light bends, how to draw ray diagrams, and the secrets to exam success. Master the concepts of optical density and total internal reflection to secure top marks.

    Isotopes

    OCR
    GCSE

    This guide provides a comprehensive overview of isotopes for OCR GCSE Physics (7.2), focusing on core definitions, calculations, and exam technique. It's designed to help you secure maximum marks by mastering the difference between isotopes and ions, understanding nuclear notation, and avoiding common pitfalls.

    Galaxies

    OCR
    GCSE

    Unlock top marks in your OCR GCSE Physics exam by mastering Galaxies (Topic 8.7). This guide breaks down the vastness of space into bite-sized, exam-focused chunks, from the structure of our Milky Way to the mind-bending evidence for the Big Bang.

    Planets

    OCR
    GCSE

    This topic covers the structure of our Solar System, the role of gravitational forces in maintaining planetary orbits, and the historical shift from geocentric to heliocentric models. Understanding these concepts is essential for securing marks in both Foundation and Higher Tier questions, particularly those testing orbital mechanics and the nature of scientific progress.

    Stars

    OCR
    GCSE

    Explore the dramatic life and death of stars, from stable main sequence suns to explosive supernovae. This guide for OCR GCSE Physics (8.6) provides everything candidates need to master stellar evolution, secure top marks, and understand our cosmic origins."

    The Solar System

    OCR
    GCSE

    This guide covers OCR GCSE Physics Topic 8.1, The Solar System. It explores the shift from geocentric to heliocentric models, the physics of orbital motion, and the complete life cycles of stars. Mastering this topic is crucial for tackling high-mark questions on stellar evolution and gravitational forces.

    Syntax error in textmermaid version 11.12.2